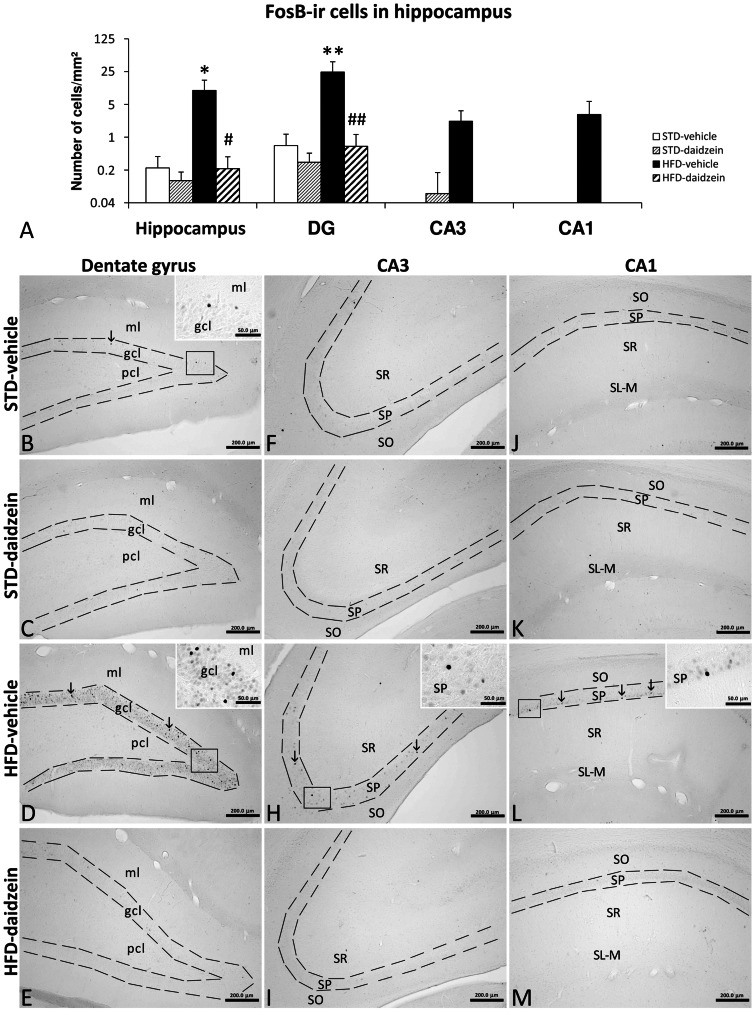
Figure 7. Effect of daidzein on the food reward factor FosB in the hippocampus of rats fed STD and HFD.
A) The histogram represents the mean ± s.e.m. per area (mm2) of FosB-ir nuclei (n = 8). B–M) Representative microphotographs show low- and high- (insets) magnification view of FosB-ir cells in the dentade gyrus, CA3 and CA1 of the hippocampus (arrows). Bonferroni post test: *P<0.05, **P<0.01 vs. STD-fed rats treated with vehicle, # P<0.05, ## P<0.01 vs. HFD-fed rats treated with vehicle. Scale bars are included in each image.

