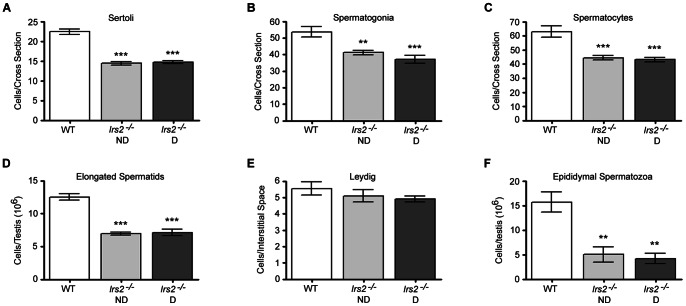
Figure 4. Analysis of distinct cell populations in the adult testis.
(A–E) Transverse histological sections 5 µm in thickness were cut through the long axis of Bouin's-fixed paraffin-embedded testes (8–12 weeks of age) and sections were probed with antibodies to specific cell types which were visualized and quantified by immunofluorescence. (A–C) Cell number per cross section of seminiferous tubule was quantified in a minimum of 50 seminiferous tubules per mouse. (A) Sertoli cells were immunostained with anti-ECad. Results are mean ± SEM of 7 WT, 12 Irs2 −/− ND, and 11 Irs2 −/− D mice. (B) Spermatogonia were immunostained with an antibody to PCNA. Results are mean ± SEM of 10 WT, 11 Irs2 −/− ND, and 10 Irs2 −/− D mice. (C) Spermatocytes were immunostained with anti-DDX4. Results are mean ± SEM of 7 WT, 8 Irs2 −/− ND, and 7 Irs2 −/− D mice. (D) Elongated spermatids were quantified by the homogenization resistant spermatid technique and are expressed as the number of elongated spermatids/testis (106). Results are mean ± SEM of 5 mice per phenotype. (E) Leydig cells were immunostained with an antibody to Nestin. A minimum of 50 interstitial spaces per mouse were examined. Results are mean ± SEM of 5 mice per phenotype. (F) Spermatozoa were collected from epididymides and quantified. Results are mean ± SEM of 5 mice per phenotype. Asterisks denote a significant difference compared to WT; ** P<0.01, *** P<0.001.

