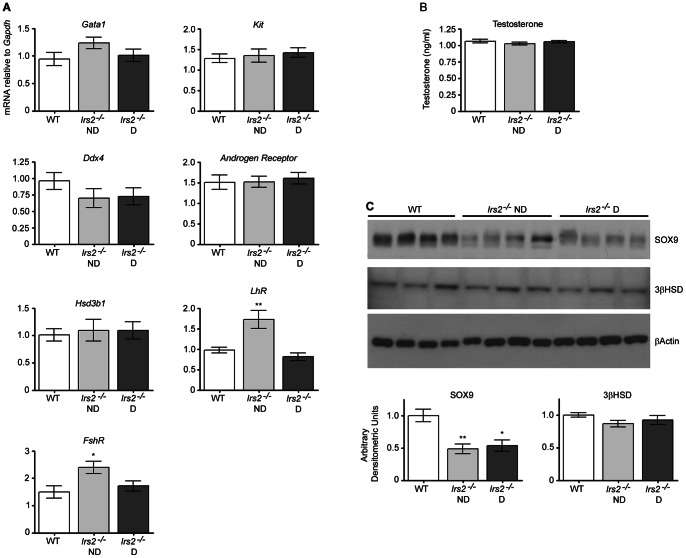
Figure 6. Analysis of cell-specific markers and serum testosterone in Irs2-deficient mice.
Quantitative RT-PCR was performed with RNA obtained from testes (8–12 weeks of age) of the indicated genotypes. (A) Sertoli cell-specific marker Gata1, spermatogonial stem cell marker Kit, spermatocyte cell marker Ddx4, Leydig and peritubular myoid cell marker Androgen receptor, or Leydig cell marker Hsd3b1. Additionally, the receptors of FSH and LH were analyzed. (B) Testosterone in serum was measured by ELISA and no differences were seen between WT and Irs2-deficient mice (P>0.05). n = 4 mice per experimental group. (C) Immunoblots of SOX9 (Sertoli cell marker) and 3βHSD (Leydig cell marker) in the testis. Testes were homogenized in lysis buffer, 20 µg of total protein was loaded per lane, and blots were probed with an antibody against SOX9 or 3βHSD. β-actin was used as a loading control. The results are representative of three independent experiments. Band intensities were quantified using Adobe Photoshop (v.CS2) and the intensity ratio for each protein was normalized to that of β-actin. Values obtained from testes of WT mice were set as 1 arbitrary densitometric unit. Results are mean ± SEM of 4 mice (SOX9) and 3 mice (3βHSD) per genotype. Asterisks denote a significant difference compared to WT; * P<0.05, ** P<0.01.

