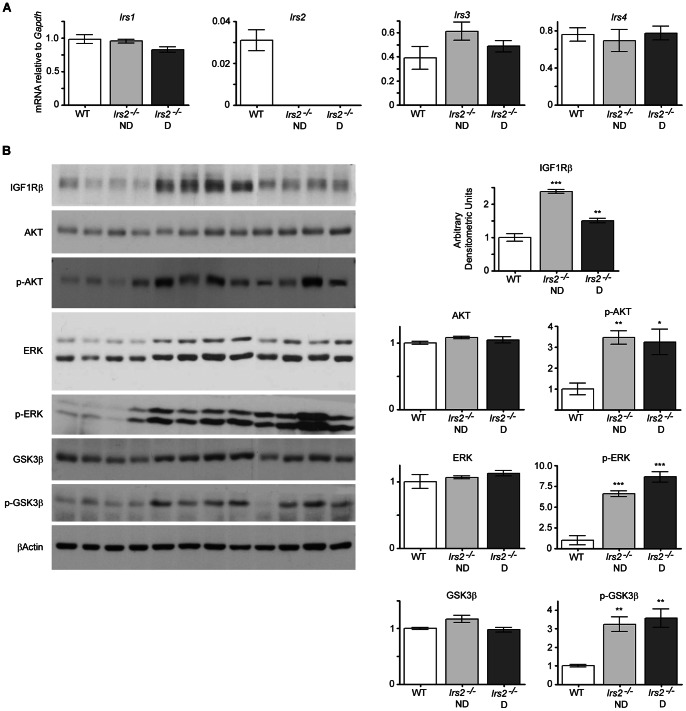
Figure 7. Insulin signalling in the testes of Irs2-deficient mice.
(A) Gene expression of IRS proteins in the testes revealed that there were no differences in expression of Irs1, Irs3, or Irs4 between WT and Irs2-deficient mice. Quantitative RT-PCR was performed using TaqMan probes. Each reaction was performed in duplicate and the value of the gene of interest was normalized to the expression of a control gene, Gapdh. For each gene, results are mean ± SEM of 5 WT, 5 Irs2 −/− ND, and 6 Irs2 −/− D mice. (B) Immunoblots of IGF1R, AKT, p-AKT, ERK, p-ERK, GSK3β, and p-GSK3β in the testis. Testes were homogenized in lysis buffer, 20 µg of total protein was loaded per lane, and blots were probed with the corresponding antibody. β-actin was used as a loading control. The results are representative of three independent experiments. Band intensities were quantified using Adobe Photoshop (v.CS2) and the intensity ratio for each protein was normalized to that of β-actin. Values obtained from testes of WT mice were set as 1 arbitrary densitometric unit. Results are mean ± SEM of 4 mice per phenotype. Asterisks denote a significant difference compared to WT; * P<0.05, ** P<0.01, *** P<0.001.

