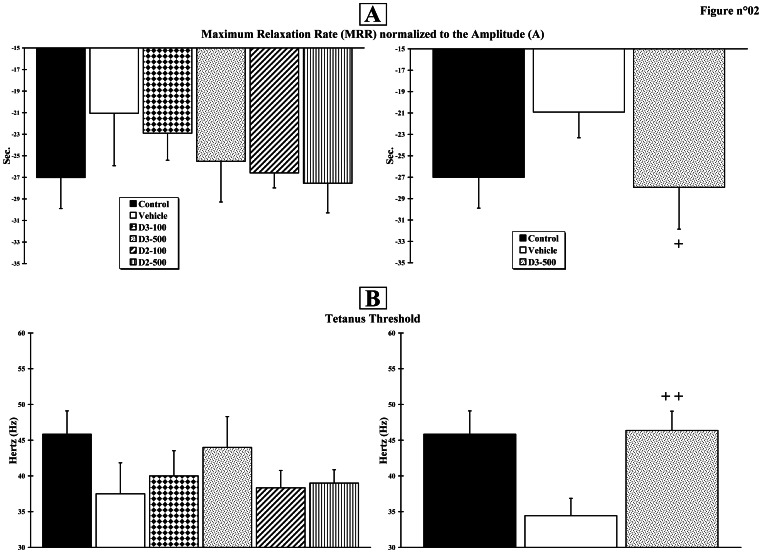
Figure 2. Muscle mechanical properties.
Muscle contractions were obtained using peroneal nerve electrical stimulation. A. Twitches were analysed in terms of peak Amplitude (A) and Maximum Relaxation Rate (MRR), defined as the slope of a tangent drawn to the steepest portion of the relaxation curve. B. Electrical stimulation frequencies were used to reach the tetanus threshold. The experiment was first assessed in the 6 initial groups (n = 6 per group; right histograms) and then in the 3 final groups (n = 12 per group; left histograms). Crosses (+) indicate significant changes when compared to the Vehicle group (+ p<0.05;++p<0.01).

