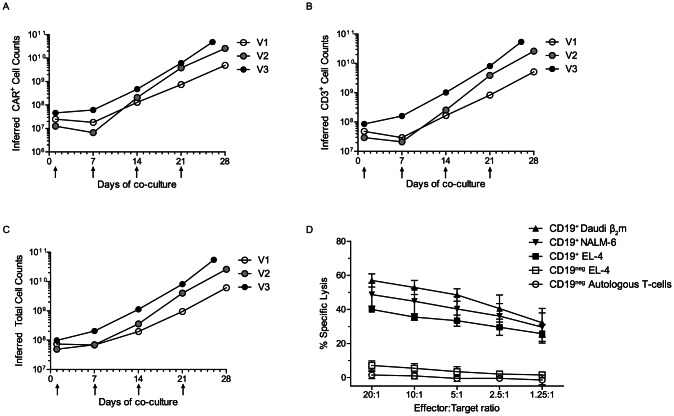
Figure 4. Expansion kinetics and redirected specificity of CAR+ T cells.
Genetically modified T cells were co-cultured with aAPC clone #4 for 28 days. At the end of each stimulation cycle (7 days), cells were counted and stained for expression of CAR and CD3. Three validation runs (V1, V2, and V3) were performed and the graphs represent inferred (A) CAR+ T cells, (B) CD3+ T cells, (C) Total viable cells over time. Arrows indicate addition of aAPC to the culture. (D) Lysis of CD19+ targets (Daudiβ2m, NALM-6, CD19+ EL-4) as compared to background lysis of CD19neg EL-4 using 4-hr chromium release assay by CAR+ T cells. Mean ± SD of three validation runs is represented.

