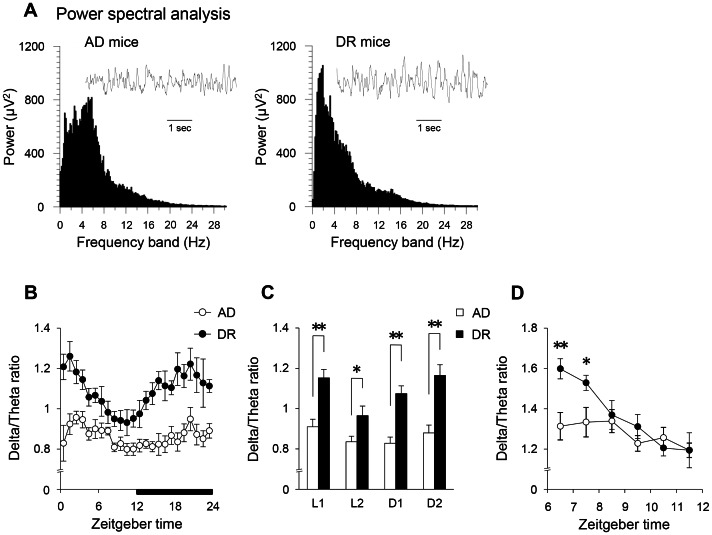
Figure 3. The influence of dietary restriction during gestation on sleep homeostasis in adult offspring mice.
Power spectral analysis of EEG during NREM sleep (A). Hourly time course changes of EEG delta/theta ratio in NREM sleep (B), and the averages for each 6-hour period (C) across ZT0-6 (L1), ZT6-12 (L2), ZT12-18 (D1), and ZT18-24 (D2). Six-hour changes of the rebound rate of delta/theta ratios after sleep deprivation (D). Open bars and circles indicate AD mice. Closed bars and circles indicate DR mice. Data represent means ± SEM (A–D; n = 6). **p<0.01 and *p<0.05 indicate a significant difference.

