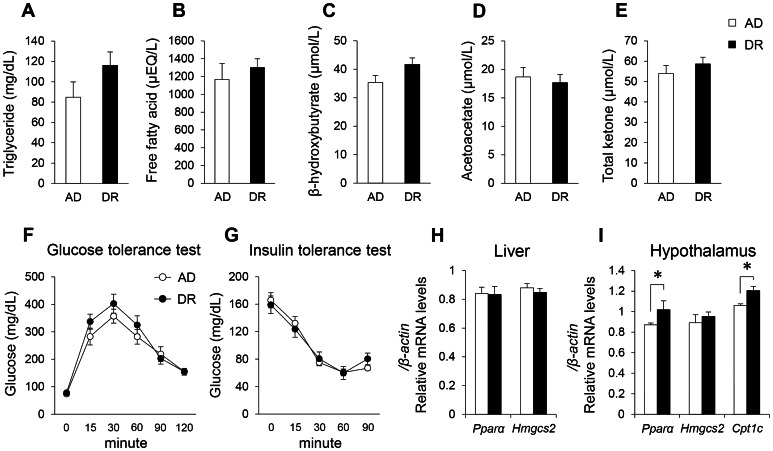
Figure 6. Metabolic state in adulthood (8–9 weeks).
The plasma levels of triglycerides (A), free fatty acids (FFAs; B), β-hydroxybutyrate (C), acetoacetate (D), and ketone bodies (E). Glucose tolerance test (GTT; F) and insulin tolerance test (ITT; G) in adulthood. Gene expression related to the regulation of lipid metabolism in liver (H) and hypothalamus (I). Open bars and circles indicate AD mice. Closed bars and circles indicate DR mice. Data represent means ± SEM (A–E; n = 6, F, G; n = 5–6, H; n = 7, I; n = 4–6). *p<0.05 indicates a significant difference.

