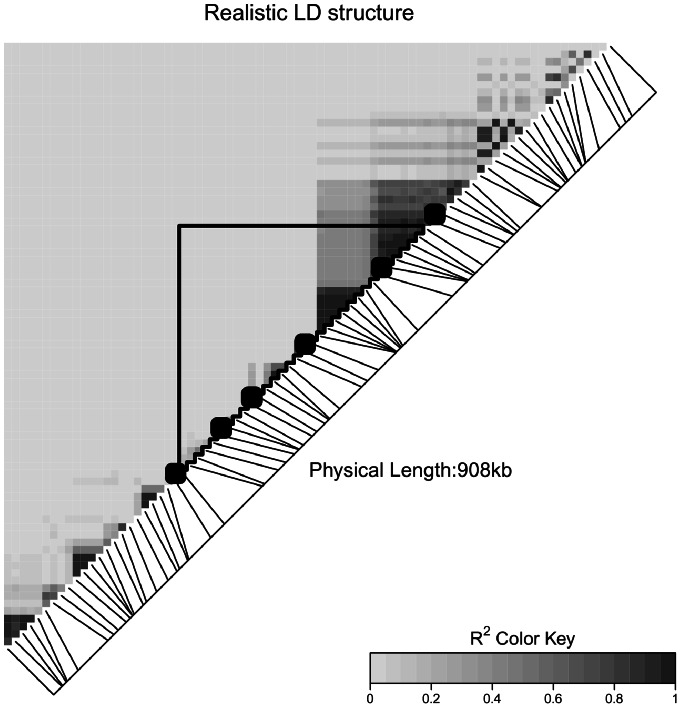
Figure 1. Heatmap of LD structure used in realistic data analysis.
Figure 1 shows a heatmap illustrating the complex LD structure utilized in the realistic data analysis. The ∼900 kb region includes an approximately 400 kb “gene” flanked by approximately 250 kb of inter-genic space on each side. There are a total of 80 common SNPs (MAF>0.05) in the region, denoted by line which indicate their location in the genome. The six causal SNPs in our analysis are indicated in bold. All other SNPs are non-causal. There is a large, moderate-strong LD block on the upper end of the gene, which crosses from inside the gene into the inter-genic space. Other LD is fairly localized to small blocks.

