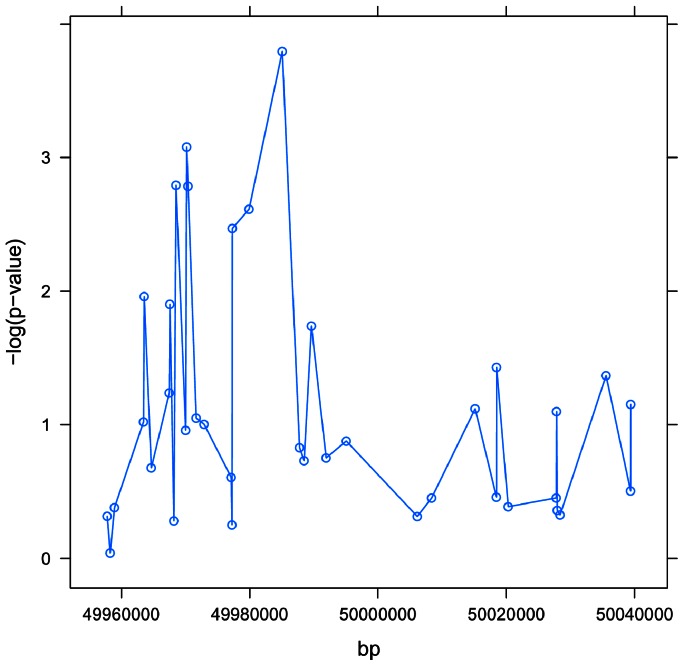
Figure 4. Manhattan plot for region in and around VSTM4.
Figure 4 illustrates the –log10 tranformed p-values located within 50 kb of VSTM4. We see two distinct regions containing small p-values: (a) a region near 49,970,000 shows 3 SNPs with transformed p-values greater than 2.3 (p-value<0.005), and another region between 49,998,000 and 49,999,000 (overlapping VSTM4) also has three SNPs with transformed p-values greater than 2.3.

