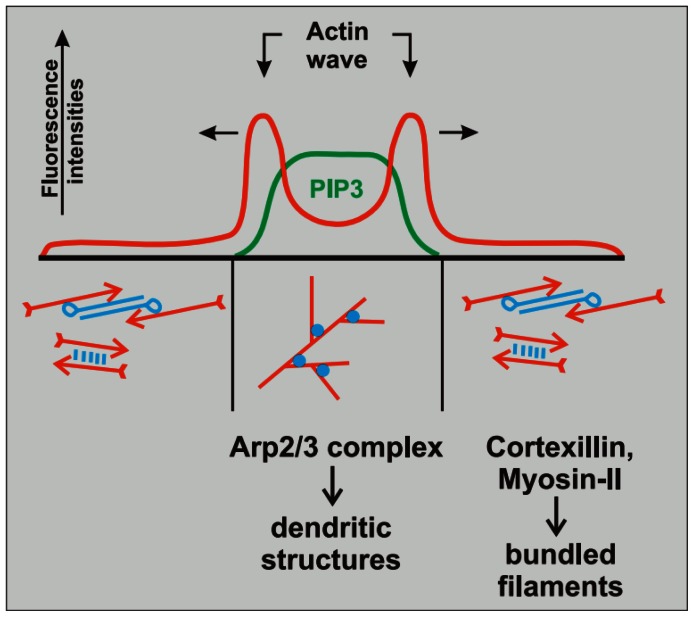
Figure 2. The spatial localization of components in an actin wave network, modified from [22].
The diagram represents F-actin and  densities along a TIRF line scan through a closed actin wave in a cell attached on a glass surface. The wave fronts are propagating outwards while
  localization coincides with the dendritic network comprising the actin wave.

