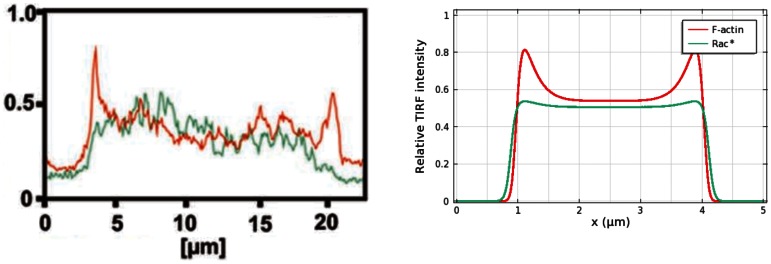
Figure 14. Relative localization of  activity.
TIRF images show localization of  activity within the region enclosed by actin waves. (Left) Experimentally-observed TIRF image from [20]. (Right) Simulated Rac concentration is used to represent
  activity.

