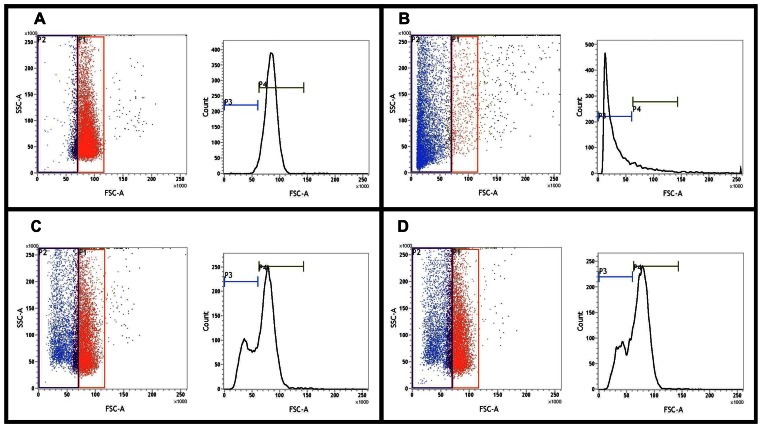
Figure 6. Hemolytic activity of T kashmirensis WT001T (Tk) measured by flow cytometry.
In all the four documents left panels represent the dot plots of the relevant flow cytometry analysis, while right panels show corresponding histograms depicting the medians of the FSC/SSC ratios. The regions of interest for all these plots were determined by first gating intact uninfected hRBCs (no lysis) in the red bordered area of A, which interned ∼87% of all hRBCs. B shows the level of hRBC lysis achieved by treatment with water. Copious shift of the hRBCs towards the left of the main red gate is noticeable with ∼83% of all hRBCs figuring in the blue bordered area on the left of the main red gate. In all subsequent calculations this level was taken as the maximum possible level of lysis or positive control. C and D respectively shows the level of hRBC lysis achieved (after four hours of infection) by Tk cells grown in iron-depleted and iron-repleted media at hRBC:bacterial cell ratio of 1∶100. In C and D respectively, ∼44% and ∼43% of the total hRBCs were found to occur in the blue bordered area on the left of the main red gate.

