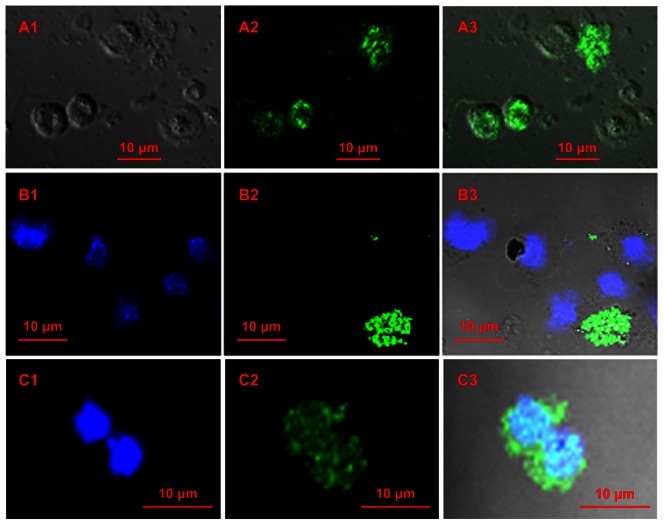
Figure 7. Laser-scanning confocal micrographs showing adhesion of T kashmirensis WT001T (Tk) to eukaryotic cell lines.
(A) Tk’s adhesion to HeLa cells. A1, DIC image showing HeLa cells; A2, image generated upon exciting only FITC shows the positions of the bacterial cells in the same field; A3, superimposition of A2 upon A1. (B) Negative control of the adhesion test involving the environmental betaproteobacterium Herminiimonas arsenicoxydans LMG 22961T and HeLa cells. B1, image generated upon exciting only DAPI shows the positions of the HeLa cells; B2, image of clumped bacterial cells from the same field generated upon exciting only FITC; B3, superimposition of B2 upon B1. (C) Tk’s adhesion to macrophage RAW264.7. C1, image generated upon exciting only DAPI shows the position of the macrophages; C2, bacterial image from the same field generated upon exciting only FITC; C3, superimposition of C2 upon C1.

