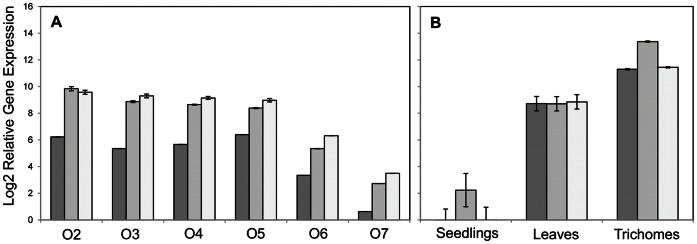
Figure 10. Log2 of the Relative Gene Expression of pyrethrum TcGAS, TcGAO and TcCOS in different tissues.

A, Expression in ovaries isolated from flowers at different developmental stages (O2 to O7). B, expression in seedlings, leaves and trichomes isolated from stage 3 ovaries. Black bars represent TcGAS, grey bars represent TcGAO and white bars represent TcCOS. The Ct value for each sample was normalized using GAPDH as housekeeping gene. Error bars represent SEM (N = 3).
