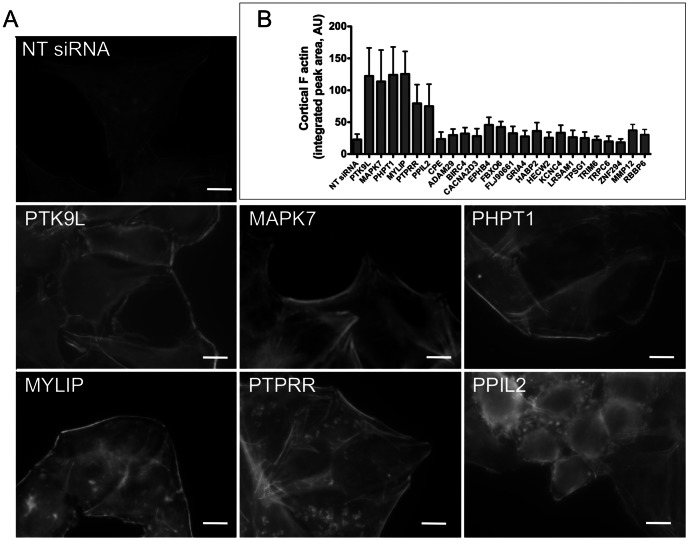
Figure 5. Validated host factors that affect actin dynamics.
A. Host cells transfected with NT siRNA or test siRNAs were fixed 72 h post-transfection and stained for F-actin using rhodamine-phalloidin. The images for NT siRNA and test siRNAs were captured with same exposure time. B. Quantification of F-actin at the periphery of the host cell 72 h post-transfection with control (NT siRNA) or test siRNAs. The results are based on three independent experiments each measuring the intensity and thickness of cortical F-actin in 10 cells at four uniformly spaced sites using line-scan analysis with standardized parameters (see also Fig. S2). Error bars, SEM.

