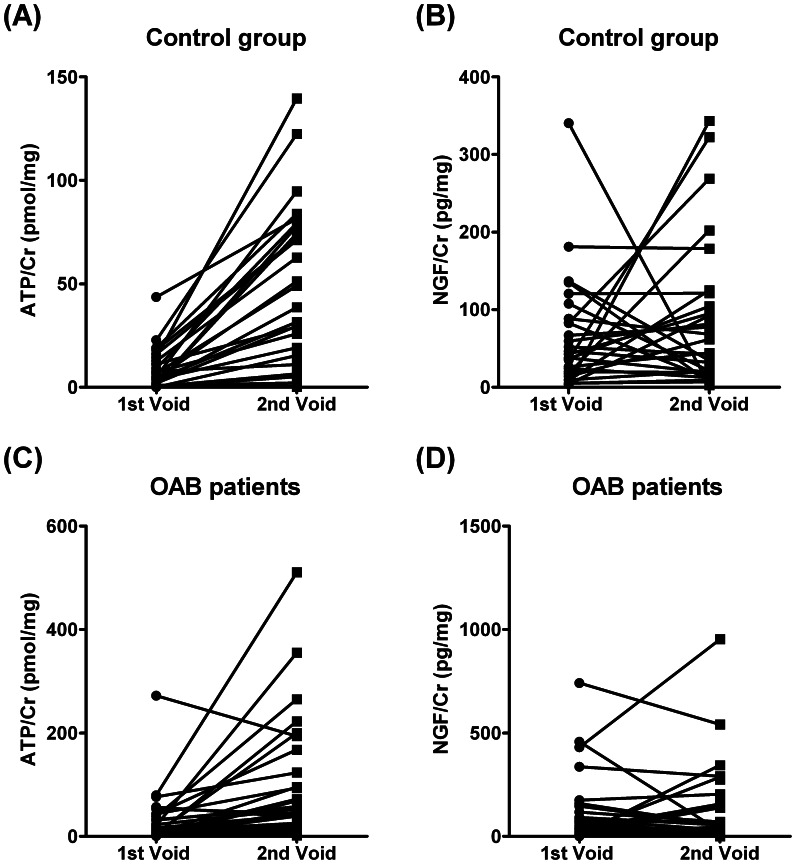
Figure 3. Analysis of ATP/Cr (pmol/mg) and NGF/Cr (pg/mg) content in paired urine samples collected from control women (A and B) and OAB patients (C and D) at arrival to the consultation (1st void) and after water intake (2nd void).
See Table 2, for correlation between variables (Spearman test).

