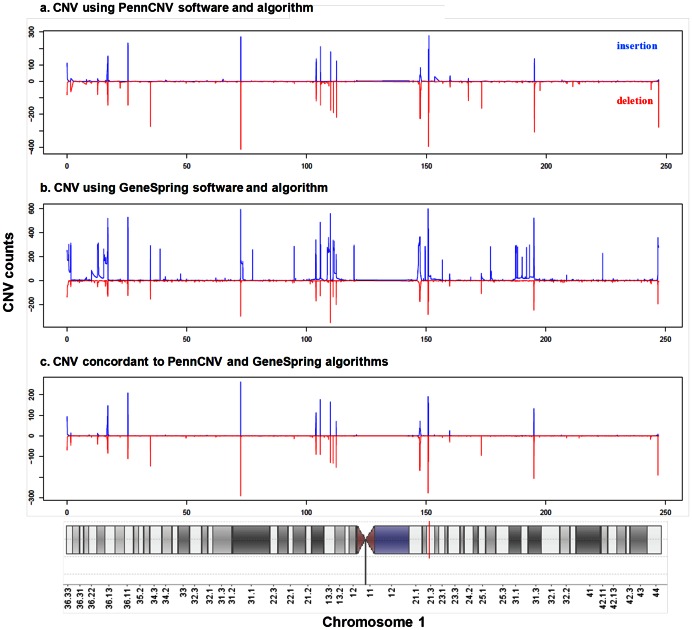
Figure 1. Distribution of insertion and deletion CNVs across chromosome 1 among European Americans: a) CNV calls based on the hidden Markov model calling algorithm PennCNV, b) CNV calls based on the change-point calling algorithm GeneSpring GX 11, and c) CNV calls based on the concordance between PennCNV and GeneSpring.
On the vertical axis, the top peaks (blue) demonstrate the actual count of insertions and the bottom peaks (red) demonstrate the actual count of deletions. The X axis shows chromosome 1 location.

