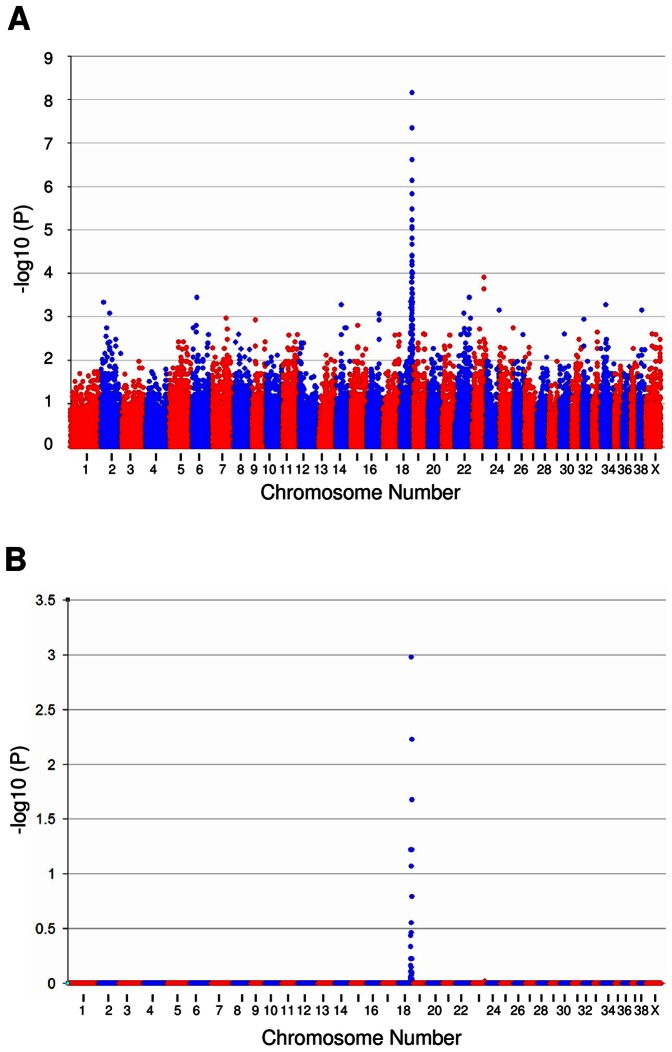
Figure 1. Allelic association analysis plots for SCA in the PRT.
Allelic association analysis on 16 SCA cases and 16 controls. Each dot represents a single SNP, with -log10 (p) values on the y-axis plotted against genome position (split into chromosomes) on the x-axis. (A) Raw unadjusted log(p) values with a strong statistical signal indicated on chromosome 18 (Praw = 7.04×10⁻⁹). (B) Plot of -log10(p) values after 100,000 maxT permutations analysis to correct for multiple testing, showing a single peak reaching genome-wide significance on chromosome 18 (Pgenome = 1.06×10⁻³).

