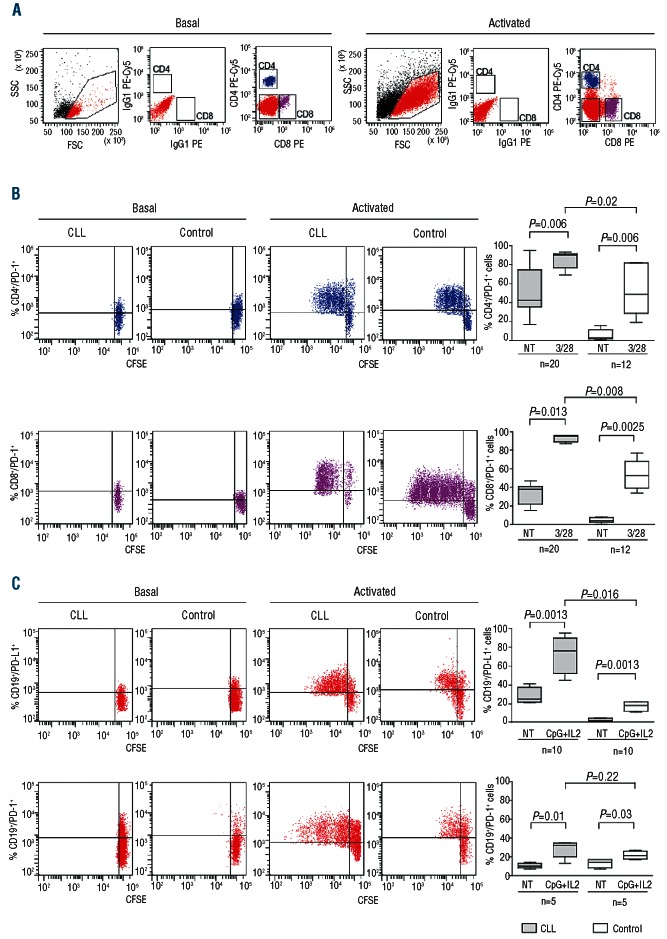
Figure 3.
Expression of the PD-1/PD-L1 pair in proliferating T lymphocytes and CLL cells. CFSE-labeled PBMC preparations from CLL patients or age- and sex-matched controls were treated with mitogenic anti-CD3 and anti-CD28 antibodies to trigger T-cell proliferation or with a combination of CpG oligonucleotides and recombinant human IL-2 to induce B-cell proliferation. Morphological gating based on FCS and SSC parameters and subsequent staining with specific antibodies allowed to identify CD4+ (blue), CD8+ (purple) and CD19+ (red) subsets (A). Representative dot plots show PD-1 and PD-L1 expression in proliferating CD4+, CD8+ (B) and CD19+ (C) subpopulations. Cumulative data from CLL patients (gray bars) and age- and sex-matched controls (open bars) are shown in the box plots on the right.

