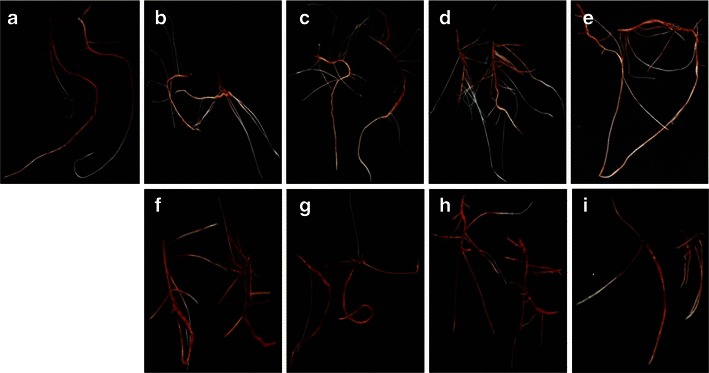
Fig. 3.

Photographs showing the root growth pattern of sorghum seedlings 7 days after jasmonic acid (JA) treatment. a = control, b = JA (0.5 μM), c = JA (1.0 μM), d = JA (5.0 μM), e = JA (10 μM), f = JA (50 μM), g = JA (100 μM), h = JA (250 μM), i = JA (500 μM)
