Abstract
Panitumumab is a fully human monoclonal antibody that targets the epidermal growth factor receptor. Results from the primary analysis of a phase 3, randomized, controlled study showed a statistically significant improvement in progression-free survival for patients receiving panitumumab; however, overall survival was confounded by best supportive care (BSC) patients that crossed over to panitumumab therapy after disease progression. Three post hoc analyses are presented that approximate the panitumumab overall survival treatment effect in both the all-randomized and wild-type (WT) KRAS populations by using the BSC patients with mutant (MT) KRAS as the comparator group to discount the effect of crossover from BSC to panitumumab. The primary post hoc analysis showed a median overall survival of 6.4 months for all KRAS-evaluable patients randomized to panitumumab versus 4.4 months for patients with MT KRAS tumors randomized to BSC, yielding an adjusted hazard ratio (95 % CI) of 0.764 (0.598-0.977). Similar results were observed for the two secondary post hoc analyses. These analyses suggest a positive treatment effect of panitumumab in both the overall and WT KRAS patient populations consistent with an improvement in overall survival relative to BSC.
Keywords (MeSH): Panitumumab, KRAS protein, Human, Colorectal neoplasms, Survival
Introduction
Colorectal cancer is the third most common cancer in the world, with more than 1.2 million new cases diagnosed annually [1]. Treatment options for metastatic colorectal cancer (mCRC) include monoclonal antibodies that target the epidermal growth factor receptor (EGFR) [2–7]. Panitumumab (Vectibix®, [Amgen Inc., Thousand Oaks, United States]), a fully human monoclonal antibody that targets the EGFR, is approved in the US as monotherapy for mCRC after disease progression, in the European Union for the treatment of patients with wild-type (WT) KRAS mCRC in first-line in combination with FOLFOX (leucovorin, fluorouracil, and oxaliplatin), in second-line in combination with FOLFIRI (leucovorin, fluorouracil, and irinotecan) in patients who have received first-line fluoropyrimidine-based chemotherapy (excluding irinotecan), and in third-line as monotherapy, and in Canada as monotherapy for the treatment of patients with EGFR-expressing WT KRAS mCRC after failure of fluoropyrimidine-, oxaliplatin-, and irinotecan-containing chemotherapy regimens.
During the conduct of a phase 3 trial (the 20020408 study) that prospectively compared panitumumab plus best supportive care (BSC) to BSC alone in patients with mCRC, a strong correlation emerged with a lack of EGFR inhibitor activity in patients with mutant (MT) KRAS tumors [8]. The primary endpoint of this study was progression-free survival (PFS). Patients randomized to BSC could cross over to panitumumab therapy in the event of disease progression on-study. Results from the primary analysis showed a statistically significant improvement in PFS for patients receiving panitumumab; however, the overall survival (OS) hazard ratio (HR) for panitumumab versus BSC was 1.00, a result confounded by the 176 (76 %) BSC patients that crossed over to panitumumab therapy after disease progression; crossover occurred early, with a median time to crossover of 7 weeks (range, 6.6 to 7.3 weeks) [2].
Patients with MT KRAS tumors do not benefit from anti-EGFR therapy, a finding confirmed in other studies and meta-analyses of EGFR inhibitors [9–13]. In the MT KRAS group in our study, no OS difference was observed between treatment arms, as evidenced by an HR (95 % CI) of 1.02 (0.75 to 1.39) [8]. In other studies, KRAS status was not prognostic for OS in patients that received BSC, chemotherapy, and chemotherapy with bevacizumab [4, 14–19]. Two meta-analyses examining tumor KRAS status and anti-EGFR monoclonal antibodies in mCRC show MT KRAS mCRC is associated with reduced overall and progression-free survival [12, 13]. Therefore, patients with MT KRAS receiving BSC with disease progression that went on to receive panitumumab likely did not benefit from panitumumab therapy. For this reason, using the MT KRAS BSC group as the comparator may remove confounding from crossover as opposed to using the entire BSC alone group, which includes patients with WT KRAS that benefited from panitumumab.
This paper describes the results from three post hoc analyses of the 20020408 study that present approximations of the panitumumab OS treatment effect in both the all-randomized (ITT) and KRAS WT populations when crossover from BSC to panitumumab is discounted by using the BSC patients with MT KRAS as the comparator group.
Patients and methods
Patients
The patients and methods for this study were previously described [2]. Briefly, eligible patients had documented disease progression after failure of fluoropyrimidines, prespecified exposure to oxaliplatin and irinotecan, Eastern Cooperative Oncology Group (ECOG) performance status 0-2, no brain metastases, no systemic chemotherapy, or radiotherapy within 30 days before randomization, and no prior anti-EGFR therapy.
Study design and treatment schedule
This was an open-label, multicenter, phase 3 trial. Patients were randomized 1:1 to receive panitumumab plus BSC or BSC alone, and randomization was stratified by geographic region (Western Europe versus Central and Eastern Europe versus rest of the world [Canada, Australia, and New Zealand]), and ECOG performance status score (0 or 1 versus 2). Panitumumab was administered intravenously over 1 h at 6.0 mg/kg every 2 weeks (Q2W). Treatment was administered until disease progression or unacceptable toxicity (Fig. 1a).
Fig. 1.
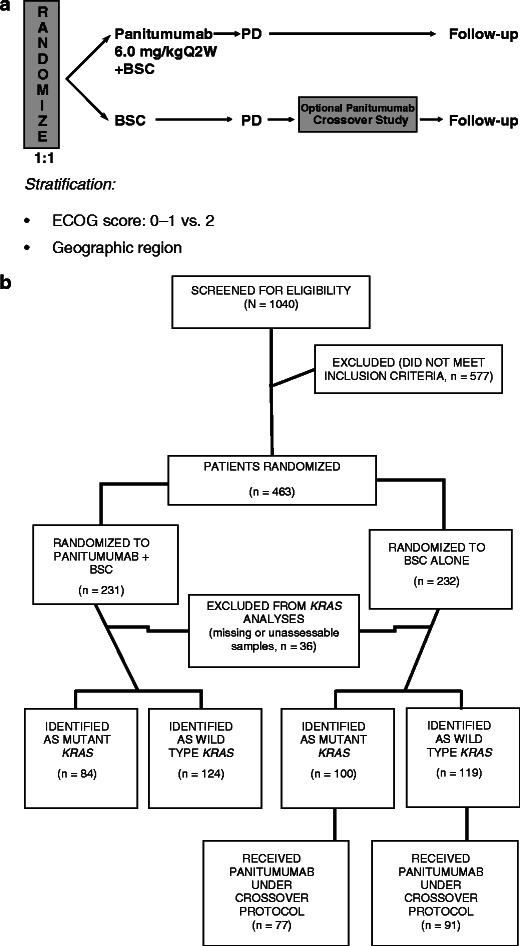
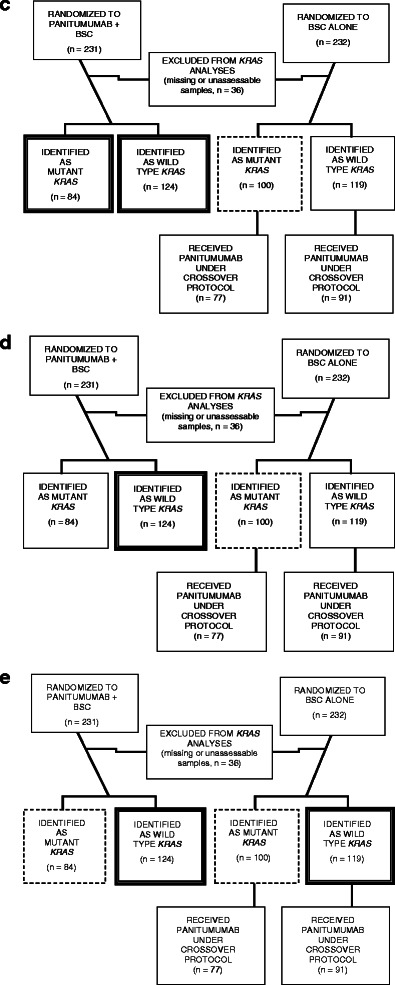
a 20020408 Study Schema, b CONSORT diagram, c groups included in the primary post hoc analysis that compared patients with MT KRAS (n = 84) and WT KRAS (n = 124) tumors who received panitumumab versus patients with MT KRAS (n = 100) tumors who received BSC alone. d Groups included in the second post hoc analysis that compared patients with WT KRAS (n = 124) tumors who received panitumumab versus patients with MT KRAS (n = 100) tumors who received BSC alone. e Groups included in the third post hoc analysis that compared patients with WT KRAS tumors who received panitumumab (n = 124) and BSC alone (n = 119) versus patients with MT KRAS tumors who received panitumumab (n = 84) and BSC alone (n = 100)
As mentioned previously, BSC patients could receive panitumumab after investigator-assessed disease progression.
The protocol was approved by the ethics committee at participating sites, and all patients signed informed consent before any study-related procedures were performed.
Statistical analyses
At the time the study was designed, the impact of tumor KRAS status on the efficacy of anti-EGFR antibodies was unknown; therefore, these analyses were not pre-specified in the original statistical analysis plan. The emergence of WT KRAS status as a requirement for panitumumab efficacy led to the subgroup analyses described here.
The primary objective of these post hoc analyses was to evaluate the OS treatment effect in both the ITT and WT KRAS populations after discounting the effect of crossover from the BSC group to panitumumab after disease progression. These exploratory and descriptive analyses included only patients with known KRAS status; all subgroups were defined prior to conducting any of the analyses.
The primary post hoc analysis was designed to best emulate what would have been expected in the original trial had there been no crossover from the BSC group to panitumumab; as such, this analysis included all KRAS-evaluable patients (both WT and MT) randomized to panitumumab versus patients with MT KRAS tumors randomized to BSC.
The second post hoc analysis was similar to the primary post hoc analysis but excluded patients randomized to panitumumab with MT KRAS tumors. In this analysis, patients randomized to panitumumab with WT KRAS tumors were compared with patients in the BSC group with MT KRAS tumors. Since patients with MT KRAS tumors were unlikely to benefit from panitumumab, this analysis provided an estimate of the treatment effect of panitumumab in patients with WT KRAS tumors.
The third post hoc analysis included all KRAS-evaluable patients with WT KRAS mCRC versus all patients with MT KRAS mCRC, regardless of the therapy to which each patient was randomized. The WT KRAS group included patients that received panitumumab and BSC alone, including patients who received panitumumab after failure of BSC treatment, potentially underestimating the panitumumab treatment effect. Similarly, the MT KRAS group included patients that received panitumumab and BSC alone, including patients who received panitumumab after failure of BSC treatment. Neither of these MT KRAS groups was likely to benefit from panitumumab.
For all of the post hoc analyses, Kaplan-Meier curves to estimate the OS difference between groups were generated. Crude and adjusted HRs for OS were estimated using Cox proportional hazards models. The crude models included only the geographic region and ECOG performance status score stratification factors. Adjusted models included variables potentially associated with OS, namely age, sex, tumor site, and baseline ECOG performance status score. Since these analyses were post hoc with the objective to approximate the OS treatment effect, no p values were calculated, and no assessment of statistical significance was made. All analyses were conducted with SAS software version 9.2 (SAS Institute, Cary, NC).
Sensitivity analyses
A key assumption for these post hoc analyses is a lack of prognostic value of KRAS status in patients treated with BSC alone. Although this assumption is supported by the literature, an analysis to examine the OS treatment effect in patients randomized to BSC alone that did not cross over to panitumumab by KRAS status was performed [8, 11]. This subgroup, however, may not be representative of the overall BSC alone population, since the primary reason for lack of crossover was early death.
Results
From January 2004 to June 2005, 463 patients were enrolled and randomized, 231 to panitumumab plus BSC versus 232 to BSC-alone. KRAS results were available for 427 (92 %) patients, 208 panitumumab plus BSC and 219 BSC alone (Fig. 1b). Of the 219 BSC-alone patients with known KRAS, 168 (77 %) crossed over to receive panitumumab at a median time of 7.1 weeks.
For these post hoc analyses, different treatment groups were utilized: patients with WT and MT KRAS receiving panitumumab (n = 208), patients with WT KRAS enrolled in the panitumumab arm (n = 124), patients with MT KRAS enrolled in the BSC arm (n = 100), patients with WT KRAS receiving panitumumab and BSC (n = 243), and patients with MT KRAS receiving panitumumab and BSC (n = 184) (Fig. 1c–e). Baseline demographics, disease characteristics, and quality-of-life measures were similar among all comparator groups (Table 1).
Table 1.
Demographics and disease characteristics
| Primary analysis | Primary and secondary analyses | Secondary analysis | Tertiary analysis | Tertiary analysis | |
|---|---|---|---|---|---|
| WT and MT KRAS panitumumab | MT KRAS BSC | WT KRAS panitumumab | WT KRAS panitumumab or BSC | MT KRAS panitumumab or BSC | |
| n = 208 | n = 100 | n = 124 | n = 243 | n = 184 | |
| Sex, n (%) | |||||
| Male | 130 (63) | 64 (64) | 83 (67) | 159 (65) | 111 (60) |
| Age, years | |||||
| Median (min, max) | 62.0 (27, 82) | 62.0 (27, 83) | 62.5 (29, 82) | 63.0 (29, 82) | 62.0 (27, 83) |
| Race, n (%) | |||||
| White | 206 (99) | 97 (97) | 122 (98) | 240 (99) | 181 (98) |
| ECOG, n (%) | |||||
| 0 | 96 (46) | 37 (37) | 53 (43) | 93 (38) | 80 (43) |
| 1 | 84 (40) | 47 (47) | 56 (45) | 118 (49) | 75 (41) |
| 2 | 28 (13) | 15 (15) | 15 (12) | 31 (13) | 28 (15) |
| 3 | 0 (0) | 1 (1) | 0 (0) | 1 (<1) | 1 (<1) |
| Primary tumor type, n (%) | |||||
| Colon | 139 (67) | 65 (65) | 86 (69) | 168 (69) | 118 (64) |
| Rectal | 69 (33) | 35 (35) | 38 (31) | 75 (31) | 66 (36) |
| Number of sites of disease | |||||
| 1 | 58 (28) | 20 (20) | 38 (31) | 68 (28) | 40 (22) |
| 2 | 84 (40) | 49 (49) | 50 (40) | 104 (43) | 83 (45) |
| 3 | 42 (20) | 25 (25) | 21 (17) | 43 (18) | 46 (25) |
| 4 | 22 (11) | 2 (2) | 14 (11) | 24 (10) | 10 (5) |
| 5 | 2 (1) | 4 (4) | 1 (1) | 2 (1) | 5 (3) |
| Sites of disease | |||||
| Liver | 161 (77) | 81 (81) | 96 (77) | 199 (82) | 146 (79) |
| Lung | 128 (62) | 64 (64) | 69 (56) | 138 (57) | 124 (67) |
| Lymph nodes | 47 (23) | 24 (24) | 31 (25) | 67 (28) | 40 (22) |
| Abdomen | 35 (17) | 20 (20) | 23 (19) | 40 (16) | 32 (17) |
| Pelvic site | 22 (11) | 9 (9) | 11 (9) | 18 (7) | 20 (11) |
| Bone | 14 (7) | 3 (3) | 9 (7) | 15 (6) | 8 (4) |
| Chest | 9 (4) | 4 (4) | 6 (5) | 8 (3) | 7 (4) |
| Gastrointestinal | 8 (4) | 3 (3) | 5 (4) | 8 (3) | 6 (3) |
| Skin | 3 (1) | 1 (1) | 1 (1) | 2 (1) | 3 (2) |
| Spleen | 2 (1) | 1 (1) | 1 (1) | 2 (1) | 2 (1) |
| Central nervous system | 1 (<1) | 0 (0) | 1 (1) | 1 (<1) | 0 (0) |
| Head | 0 (0) | 0 (0) | 0 (0) | 0 (0) | 0 (0) |
| Neck | 0 (0) | 0 (0) | 0 (0) | 0 (0) | 0 (0) |
| Other | 19 (9) | 11 (11) | 9 (7) | 13 (5) | 21 (11) |
| Any prior chemotherapya | 208 (100) | 100 (100) | 124 (100) | 243 (100) | 184 (100) |
| Prior adjuvant chemotherapy | 77 (63) | 40 (40) | 50 (40) | 82 (34) | 67 (36) |
| Prior anti-tumor therapyb | 12 (6) | 2 (2) | 7 (6) | 12 (5) | 7 (4) |
| Prior radiotherapy (includes radiofrequency ablation) | 54 (26) | 29 (29) | 29 (23) | 62 (26) | 54 (29) |
| Last regimen prior to study entry | |||||
| Oxaliplatin containing regimens | 88 (42)) | 43 (43) | 57 (46) | 106 (44) | 74 (40) |
| Irinotecan containing regimens | 97 (47) | 50 (50) | 55 (44) | 110 (45) | 92 (50) |
| Both oxaliplatin and irinotecan | 1 (<1) | 0 (0) | 1 (1) | 3(1) | 0(0) |
| Fluoropyrimidine without oxaliplatin or irinotecan | 19 (9) | 6 (6) | 10 (8) | 21 (9) | 15 (8) |
| Other | 0 (0) | 1 (1) | 1 (1) | 3(1) | 3 (2) |
| Region, n (%) | |||||
| Western Europe | 157 (75) | 77 (77) | 93 (75) | 187 (77) | 141 (77) |
| Central/Eastern Europe | 19 (9) | 7 (7) | 9 (7) | 19 (8) | 17 (9) |
| Rest of world | 32 (15) | 16 (16) | 22 (18) | 37 (15) | 26 (14) |
| EQ-5D score at baseline, median (min, max)c | 0.76 (0.16, 1.00) | 0.73 (0.59, 1.00) | 0.76 (0.16, 1.00) | 0.74 (0.16, 1.00) | 0.73 (0.59, 1.00) |
| FACT-CRC raw score at baseline, mean (SD) | 77.8 (15.3) | 77.4 (16.6) | 78.8 (14.7) | 78.9 (14.3) | 76.9 (16.3) |
aPatients had multiple prior regimens
bDoes not include systemic chemotherapy; does include carboplatin as chemo-embolization
cEQ-5D score range, 0.0 (death) to 1.0 (perfect health)
The primary analysis results indicate median OS was 6.4 months for all KRAS-evaluable patients randomized to panitumumab versus 4.4 months for patients with MT KRAS tumors randomized to BSC (Fig. 2). Table 2 presents the crude and adjusted HRs for the post hoc analyses. This approximation of the all-randomized panitumumab OS treatment effect yielded an adjusted HR (95 % CI) of 0.764 (0.598-0.977).
Fig. 2.
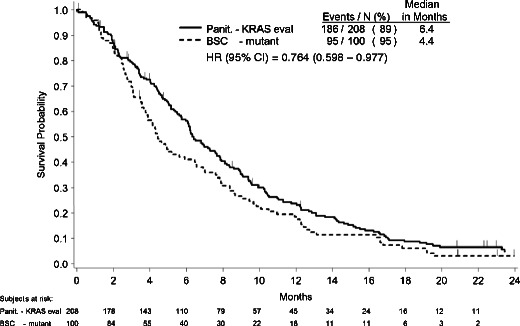
Kaplan–Meier estimate of overall survival for KRAS-evaluable patients randomized to panitumumab versus patients randomized to BSC with KRAS mutant tumors
Table 2.
Summary of OS HR estimates from the post hoc analyses
| Description | Crude HR (95 % CI) | Adjusted HRa (95 % CI) | Median (months) |
|---|---|---|---|
| WT and MT KRAS panitumumab versus MT KRAS BSC | 0.777 (0.606–0.996) | 0.764 (0.598–0.977) | 6.4 vs 4.4 |
| WT KRAS panitumumab versus MT KRAS BSC | 0.668 (0.505–0.883) | 0.656 (0.494–0.872) | 8.1 vs 4.4 |
| WT KRAS panitumumab + BSC versus MT KRAS panitumumab + BSC | 0.668 (0.546–0.818) | 0.622 (0.506–0.764) | 7.9 vs 4.7 |
aHR adjusted for variables potentially associated with OS: age, sex, tumor site, and baseline ECOG score
In the second analysis, median OS was 8.1 months for patients with WT KRAS tumors randomized to panitumumab versus 4.4 months for patients with MT KRAS tumors randomized to BSC (Fig. 3). This approximation of the WT KRAS panitumumab OS treatment effect yielded an adjusted HR (95 % CI) of 0.656 (0.494-0.872; Table 2).
Fig. 3.
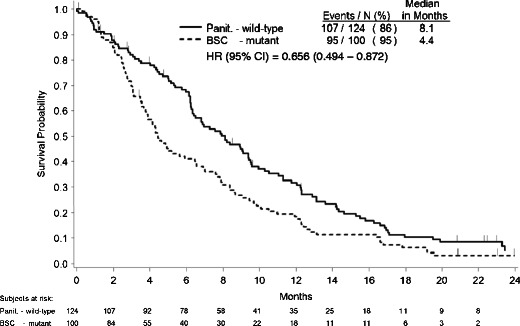
Kaplan–Meier estimate of overall survival for patients randomized to panitumumab with KRAS wild-type tumors versus patients randomized to BSC patients with KRAS mutant tumor
In the third analysis, median OS was 7.9 months for all patients with WT KRAS versus 4.7 months for all patients with MT KRAS tumors, regardless of treatment group assignment (Fig. 4). This approximation of the WT KRAS panitumumab OS treatment effect yielded an adjusted HR (95 % CI) of 0.622 (0.506-0.764; Table 2).
Fig. 4.
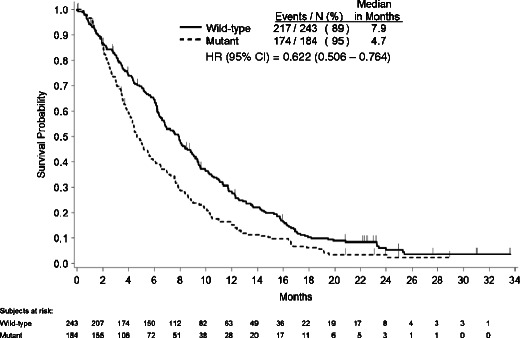
Kaplan–Meier estimate of overall survival for patients with KRAS wild-type versus KRAS mutant tumors
The post hoc analyses presented above depend on the assumption that KRAS status has no prognostic effect on OS in patients treated with BSC alone. As such, a sensitivity analysis of patients randomized to BSC that did not cross over to panitumumab by tumor KRAS status was performed that found median OS was 1.9 months for patients (n = 28) with WT KRAS tumors and 2.0 months for patients (n = 23) with MT KRAS tumors (Fig. 5). Although this subgroup may not be representative of the overall BSC population, these results support the assumption that tumor KRAS status has no prognostic impact on patients treated with BSC alone, upholding this post hoc analysis.
Fig. 5.
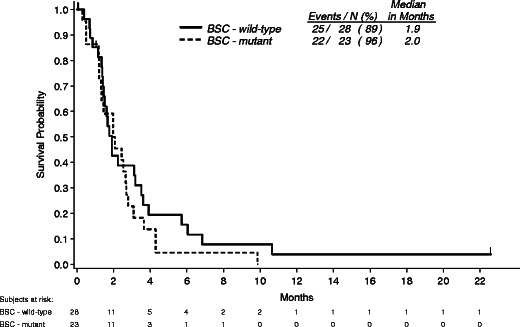
Kaplan–Meier estimate of overall survival by KRAS status among BSC patients that did not crossover to panitumumab
An additional sensitivity analysis was performed since patients were not randomized at the level of KRAS status. It is possible that imbalances in unmeasured prognostic factors (other than those considered in the adjusted model) may have introduced residual confounding. Thus, a sensitivity analysis using the array approach was conducted to quantify the effect of a known or unknown, unmeasured confounder on the observed association between panitumumab and OS in the ITT population [20].
Using this approach, we fixed the prevalence of a hypothetical confounder in the BSC MT KRAS group to 0.3 and varied the strength of the confounder–outcome association (1.0 to 5.5) and the prevalence of the confounder in the panitumumab group (0.0 to 5.0). The interrelationship between these three factors was plotted in three-dimensional graphic representation (Fig. 6).
Fig. 6.
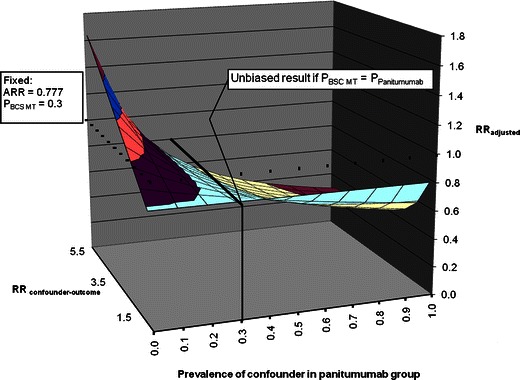
Array approach for confounding bias
There is no bias when the confounder is equally distributed between the panitumumab and BSC MT KRAS tumor groups. However, with increasing imbalance of the confounder between the two groups, the fully adjusted estimate moves away from the observed HR. Specifically, if the prevalence of the confounder in the panitumumab group is inferior to the prevalence of the confounder in the BSC MT KRAS tumor group, then the “true” HR would be higher than the observed HR. This would require the confounder to be strongly associated with the outcome, with RR estimates ranging from 3.5 to 5.5. Conversely, if the prevalence of the confounder in the panitumumab group is superior to the prevalence of the confounder in the BSC MT KRAS tumor group, then the “true” HR would be less than the observed HR. Other than age, sex, tumor site, and ECOG performance status score, all of which were controlled for in the adjusted model, the likelihood of an unknown, unmeasured confounder of a magnitude necessary to impact outcomes is slim.
This sensitivity analysis demonstrates through quantification of the effect of a known or unknown, unmeasured confounder on the observed association between panitumumab and OS that, if these post hoc analyses are subject to bias, that either a confounder with an unlikely magnitude of impact exists or the observed OS effect is valid in spite of the bias.
Discussion
The results from these analyses suggest that crossover from BSC to panitumumab had an impact on OS in both the overall and WT KRAS patient populations. Controlling for these crossover patients demonstrated a trend toward improved OS that could have been detected in the original study if crossover were not permitted. Since patients with MT KRAS tumors were unlikely to benefit from panitumumab therapy and the evidence suggests KRAS has no OS prognostic effect with BSC alone, this post hoc analysis gives an approximation of the all-randomized treatment effect of panitumumab on OS after discounting the impact of crossover from BSC to panitumumab treatment in the original trial. In a similar manner, the second and third analyses provided approximations of the treatment effect of panitumumab on OS in patients with WT KRAS tumors, also discounting the effect of crossover. In these analyses, the HRs were consistently under 1, suggesting a positive panitumumab treatment effect. Of note, a similar improvement in OS was observed with cetuximab therapy relative to BSC alone in a trial in which no crossover was allowed in a similar patient population [4]. The results of these post hoc analyses are consistent with the statistically significant PFS effect from the primary analysis of this study.
Post hoc analyses and the conclusions that can be drawn from them are limited by bias. Concerns included the introduction of bias through patient selection, whether tumor KRAS status was prognostic for OS with BSC alone, and the treatment effect of panitumumab, if any, on OS in patients with MT KRAS tumors. Patient selection bias was minimized because the demographics and disease characteristics of the control groups represented a random sample of patients enrolled in the study. Indeed, the demographics and disease characteristics of the control groups were similar to all other comparator groups in these analyses. The assumption that tumor KRAS status is not prognostic for OS is supported in both the literature and in the trend toward no difference between patients with WT and MT KRAS tumors in patients randomized to BSC that did not cross over to panitumumab. In addition, patient treatment decisions were made without knowledge of tumor KRAS status. Evidence for the lack of a treatment effect of panitumumab on OS in patients with MT KRAS tumors from the original KRAS analysis of this study provided further evidence of the lack of bias that might be introduced by using patients with MT KRAS tumors as a comparator group.
The crude and adjusted HR estimates in the three analyses were very similar, indicating that the potential confounders considered were relatively well-balanced between the exposure groups. Furthermore, the sensitivity analysis based on the array approach indicated that it is unlikely that the observed results were biased by an unknown or unmeasured confounder [20]. In fact, confounding bias would only be present in extreme conditions, with a confounder very strongly associated with the outcome being largely differentially distributed between the exposure groups. Such a scenario is thought to be unlikely, as we adjusted for known important confounders.
In summary, these analyses show a positive treatment effect of panitumumab on OS in both the overall and WT KRAS patient populations that could have been detected in the original study and in the prospective–retrospective analysis by KRAS status if crossover from BSC to panitumumab had not been permitted.
Acknowledgments
This work was funded by Amgen, Inc. The authors thank the patients, families, the study staffs, the study team at Amgen Inc, Glen Saunders from G.Saunders Enterprises Inc for statistical support and James Ziobro for assistance with the preparation of this manuscript, funded by Amgen Inc.
Conflict of interest disclosures
Melanie Poulin-Costello is an employee and stockholder of Amgen, Inc. Laurent Azoulay serves as a consultant to Amgen Canada Inc. Eric Van Cutsem’s institution receives research funding from Amgen, Inc. Marc Peeters serves as a consultant and advisor and has received honoraria from Amgen, Inc. Salvatore Siena serves as a consultant and advisor to Merck Serono, AstraZeneca, Roche, and Sanofi-Aventis. Michael Wolf is an employee and stockholder of Amgen, Inc.
Footnotes
This study was registered at clinicaltrials.gov: NCT00113763.
References
- 1.Jemal A, Bray F, Center MM, Ferlay J, Ward E, Forman D. Global cancer statistics. CA Cancer J Clin. 2011;61(2):69–90. doi: 10.3322/caac.20107. [DOI] [PubMed] [Google Scholar]
- 2.Van Cutsem E, Peeters M, Siena S, Humblet Y, Hendlisz A, Neyns B, Canon JL, Van Laethem JL, Maurel J, Richardson G, Wolf M, Amado RG. Open-label phase III trial of panitumumab plus best supportive care compared with best supportive care alone in patients with chemotherapy-refractory metastatic colorectal cancer. J Clin Oncol. 2007;25(13):1658–1664. doi: 10.1200/JCO.2006.08.1620. [DOI] [PubMed] [Google Scholar]
- 3.Cunningham D, Humblet Y, Siena S, Khayat D, Bleiberg H, Santoro A, Bets D, Mueser M, Harstrick A, Verslype C, Chau I, Van Cutsem E. Cetuximab monotherapy and cetuximab plus irinotecan in irinotecan-refractory metastatic colorectal cancer. N Engl J Med. 2004;351(4):337–345. doi: 10.1056/NEJMoa033025. [DOI] [PubMed] [Google Scholar]
- 4.Jonker DJ, O'Callaghan CJ, Karapetis CS, Zalcberg JR, Tu D, Au HJ, Berry SR, Krahn M, Price T, Simes RJ, Tebbutt NC, van Hazel G, Wierzbicki R, Langer C, Moore MJ. Cetuximab for the treatment of colorectal cancer. N Engl J Med. 2007;357(20):2040–2048. doi: 10.1056/NEJMoa071834. [DOI] [PubMed] [Google Scholar]
- 5.Van Cutsem E, Kohne CH, Hitre E, Zaluski J, Chang Chien CR, Makhson A, D'Haens G, Pinter T, Lim R, Bodoky G, Roh JK, Folprecht G, Ruff P, Stroh C, Tejpar S, Schlichting M, Nippgen J, Rougier P. Cetuximab and chemotherapy as initial treatment for metastatic colorectal cancer. N Engl J Med. 2009;360(14):1408–1417. doi: 10.1056/NEJMoa0805019. [DOI] [PubMed] [Google Scholar]
- 6.Douillard JY, Siena S, Cassidy J, Tabernero J, Burkes R, Barugel M, Humblet Y, Bodoky G, Cunningham D, Jassem J, Rivera F, Kocakova I, Ruff P, Blasinska-Morawiec M, Smakal M, Canon JL, Rother M, Oliner KS, Wolf M, Gansert J. Randomized, phase III trial of panitumumab with infusional fluorouracil, leucovorin, and oxaliplatin (FOLFOX4) versus FOLFOX4 alone as first-line treatment in patients with previously untreated metastatic colorectal cancer: the PRIME study. J Clin Oncol. 2010;28(31):4697–4705. doi: 10.1200/JCO.2009.27.4860. [DOI] [PubMed] [Google Scholar]
- 7.Peeters M, Price TJ, Cervantes A, Sobrero AF, Ducreux M, Hotko Y, Andre T, Chan E, Lordick F, Punt CJ, Strickland AH, Wilson G, Ciuleanu TE, Roman L, Van Cutsem E, Tzekova V, Collins S, Oliner KS, Rong A, Gansert J. Randomized phase III study of panitumumab with fluorouracil, leucovorin, and irinotecan (FOLFIRI) compared with FOLFIRI alone as second-line treatment in patients with metastatic colorectal cancer. J Clin Oncol. 2010;28(31):4706–4713. doi: 10.1200/JCO.2009.27.6055. [DOI] [PubMed] [Google Scholar]
- 8.Amado RG, Wolf M, Peeters M, Van Cutsem E, Siena S, Freeman DJ, Juan T, Sikorski R, Suggs S, Radinsky R, Patterson SD, Chang DD. Wild-type KRAS is required for panitumumab efficacy in patients with metastatic colorectal cancer. J Clin Oncol. 2008;26(10):1626–1634. doi: 10.1200/JCO.2007.14.7116. [DOI] [PubMed] [Google Scholar]
- 9.De Roock W, Piessevaux H, De Schutter J, Janssens M, De Hertogh G, Personeni N, Biesmans B, Van Laethem JL, Peeters M, Humblet Y, Van Cutsem E, Tejpar S. KRAS wild-type state predicts survival and is associated to early radiological response in metastatic colorectal cancer treated with cetuximab. Ann Oncol. 2008;19(3):508–515. doi: 10.1093/annonc/mdm496. [DOI] [PubMed] [Google Scholar]
- 10.De Roock W, Claes B, Bernasconi D, De Schutter J, Biesmans B, Fountzilas G, Kalogeras KT, Kotoula V, Papamichael D, Laurent-Puig P, Penault-Llorca F, Rougier P, Vincenzi B, Santini D, Tonini G, Cappuzzo F, Frattini M, Molinari F, Saletti P, De Dosso S, Martini M, Bardelli A, Siena S, Sartore-Bianchi A, Tabernero J, Macarulla T, Di Fiore F, Gangloff AO, Ciardiello F, Pfeiffer P, Qvortrup C, Hansen TP, Van Cutsem E, Piessevaux H, Lambrechts D, Delorenzi M, Tejpar S. Effects of KRAS, BRAF, NRAS, and PIK3CA mutations on the efficacy of cetuximab plus chemotherapy in chemotherapy-refractory metastatic colorectal cancer: a retrospective consortium analysis. Lancet Oncol. 2010;11(8):753–762. doi: 10.1016/S1470-2045(10)70130-3. [DOI] [PubMed] [Google Scholar]
- 11.Karapetis CS, Khambata-Ford S, Jonker DJ, O'Callaghan CJ, Tu D, Tebbutt NC, Simes RJ, Chalchal H, Shapiro JD, Robitaille S, Price TJ, Shepherd L, Au HJ, Langer C, Moore MJ, Zalcberg JR. K-ras mutations and benefit from cetuximab in advanced colorectal cancer. N Engl J Med. 2008;359(17):1757–1765. doi: 10.1056/NEJMoa0804385. [DOI] [PubMed] [Google Scholar]
- 12.Lin AY, Buckley NS, Lu AT, Kouzminova NB, Salpeter SR. Effect of KRAS mutational status in advanced colorectal cancer on the outcomes of anti-epidermal growth factor receptor monoclonal antibody therapy: a systematic review and meta-analysis. Clin Colorectal Cancer. 2011;10(1):63–69. doi: 10.3816/CCC.2011.n.009. [DOI] [PubMed] [Google Scholar]
- 13.Dahabreh IJ, Terasawa T, Castaldi PJ, Trikalinos TA. Systematic review: anti-epidermal growth factor receptor treatment effect modification by KRAS mutations in advanced colorectal cancer. Ann Intern Med. 2011;154(1):37–49. doi: 10.7326/0003-4819-154-1-201101040-00006. [DOI] [PubMed] [Google Scholar]
- 14.Roth AD, Tejpar S, Delorenzi M, Yan P, Fiocca R, Klingbiel D, Dietrich D, Biesmans B, Bodoky G, Barone C, Aranda E, Nordlinger B, Cisar L, Labianca R, Cunningham D, Van Cutsem E, Bosman F. Prognostic role of KRAS and BRAF in stage II and III resected colon cancer: results of the translational study on the PETACC-3, EORTC 40993, SAKK 60–00 trial. J Clin Oncol. 2010;28(3):466–474. doi: 10.1200/JCO.2009.23.3452. [DOI] [PubMed] [Google Scholar]
- 15.Ogino S, Meyerhardt JA, Irahara N, Niedzwiecki D, Hollis D, Saltz LB, Mayer RJ, Schaefer P, Whittom R, Hantel A, Benson AB, 3rd, Goldberg RM, Bertagnolli MM, Fuchs CS. KRAS mutation in stage III colon cancer and clinical outcome following intergroup trial CALGB 89803. Clin Cancer Res. 2009;15(23):7322–7329. doi: 10.1158/1078-0432.CCR-09-1570. [DOI] [PMC free article] [PubMed] [Google Scholar]
- 16.Etienne-Grimaldi MC, Formento JL, Francoual M, Francois E, Formento P, Renee N, Laurent-Puig P, Chazal M, Benchimol D, Delpero JR, Letoublon C, Pezet D, Seitz JF, Milano G. K-Ras mutations and treatment outcome in colorectal cancer patients receiving exclusive fluoropyrimidine therapy. Clin Cancer Res. 2008;14(15):4830–4835. doi: 10.1158/1078-0432.CCR-07-4906. [DOI] [PubMed] [Google Scholar]
- 17.Ince WL, Jubb AM, Holden SN, Holmgren EB, Tobin P, Sridhar M, Hurwitz HI, Kabbinavar F, Novotny WF, Hillan KJ, Koeppen H. Association of k-ras, b-raf, and p53 status with the treatment effect of bevacizumab. J Natl Cancer Inst. 2005;97(13):981–989. doi: 10.1093/jnci/dji174. [DOI] [PubMed] [Google Scholar]
- 18.Tol J, Koopman M, Cats A, Rodenburg CJ, Creemers GJ, Schrama JG, Erdkamp FL, Vos AH, van Groeningen CJ, Sinnige HA, Richel DJ, Voest EE, Dijkstra JR, Vink-Borger ME, Antonini NF, Mol L, van Krieken JH, Dalesio O, Punt CJ. Chemotherapy, bevacizumab, and cetuximab in metastatic colorectal cancer. N Engl J Med. 2009;360(6):563–572. doi: 10.1056/NEJMoa0808268. [DOI] [PubMed] [Google Scholar]
- 19.Rosty C, Chazal M, Etienne MC, Letoublon C, Bourgeon A, Delpero JR, Pezet D, Beaune P, Laurent-Puig P, Milano G. Determination of microsatellite instability, p53 and K-RAS mutations in hepatic metastases from patients with colorectal cancer: relationship with response to 5-fluorouracil and survival. Int J Cancer. 2001;95(3):162–167. doi: 10.1002/1097-0215(20010520)95:3<162::AID-IJC1028>3.0.CO;2-J. [DOI] [PubMed] [Google Scholar]
- 20.Schneeweiss S. Sensitivity analysis and external adjustment for unmeasured confounders in epidemiologic database studies of therapeutics. Pharmacoepidemiol Drug Saf. 2006;15(5):291–303. doi: 10.1002/pds.1200. [DOI] [PubMed] [Google Scholar]


