
Fig. 1.
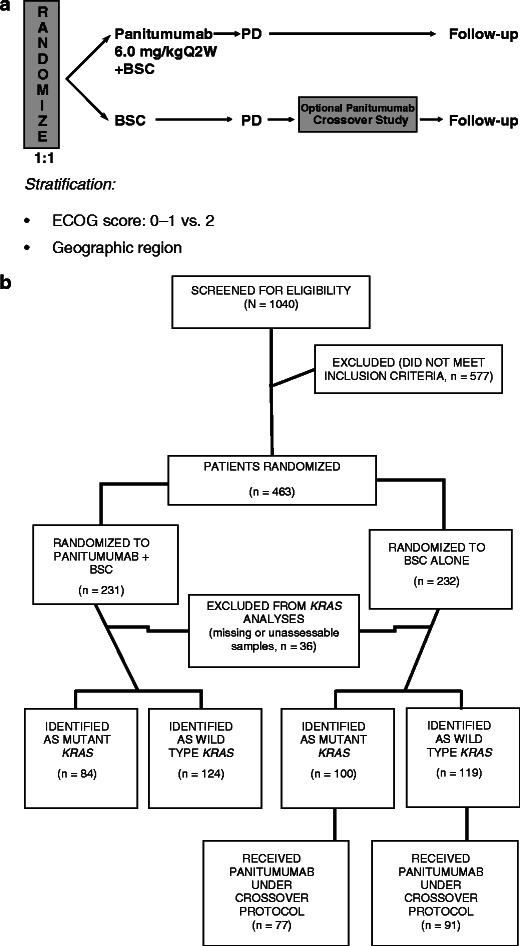
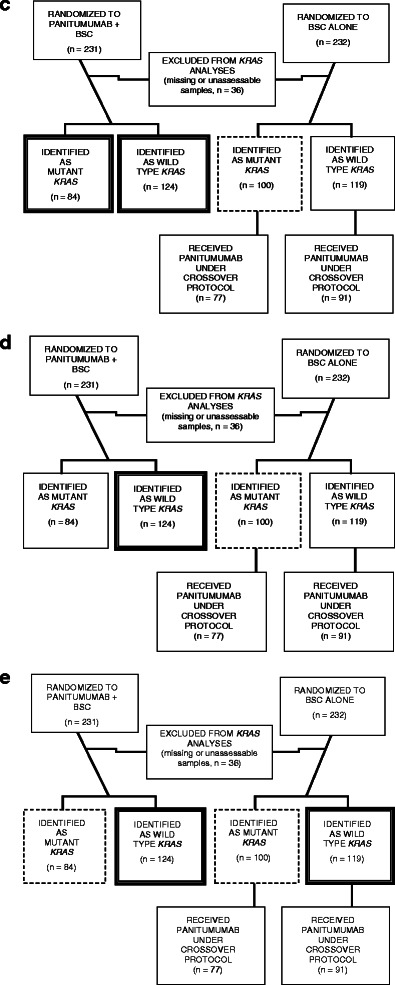
a 20020408 Study Schema, b CONSORT diagram, c groups included in the primary post hoc analysis that compared patients with MT KRAS (n = 84) and WT KRAS (n = 124) tumors who received panitumumab versus patients with MT KRAS (n = 100) tumors who received BSC alone. d Groups included in the second post hoc analysis that compared patients with WT KRAS (n = 124) tumors who received panitumumab versus patients with MT KRAS (n = 100) tumors who received BSC alone. e Groups included in the third post hoc analysis that compared patients with WT KRAS tumors who received panitumumab (n = 124) and BSC alone (n = 119) versus patients with MT KRAS tumors who received panitumumab (n = 84) and BSC alone (n = 100)