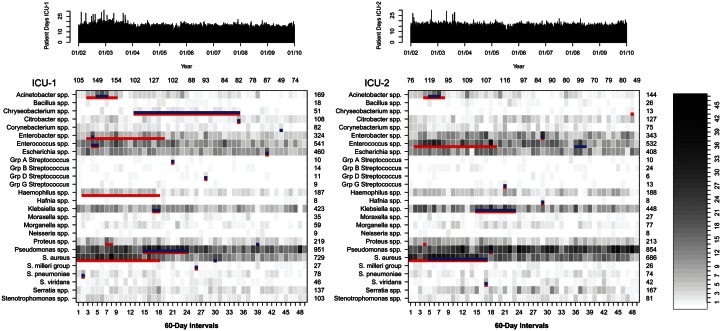
Figure 1.
Incidence of identification of species-groups from patient clinical samples in 2 adjacent intensive care units (ICUs). Detected outbreaks after temporal adjustment for underlying temporal trends are depicted in blue. Red lines show outbreaks that would have been detected if no temporal adjustment had been applied. The number of patient-days for each ICU is shown at top.

