
Figure 2.
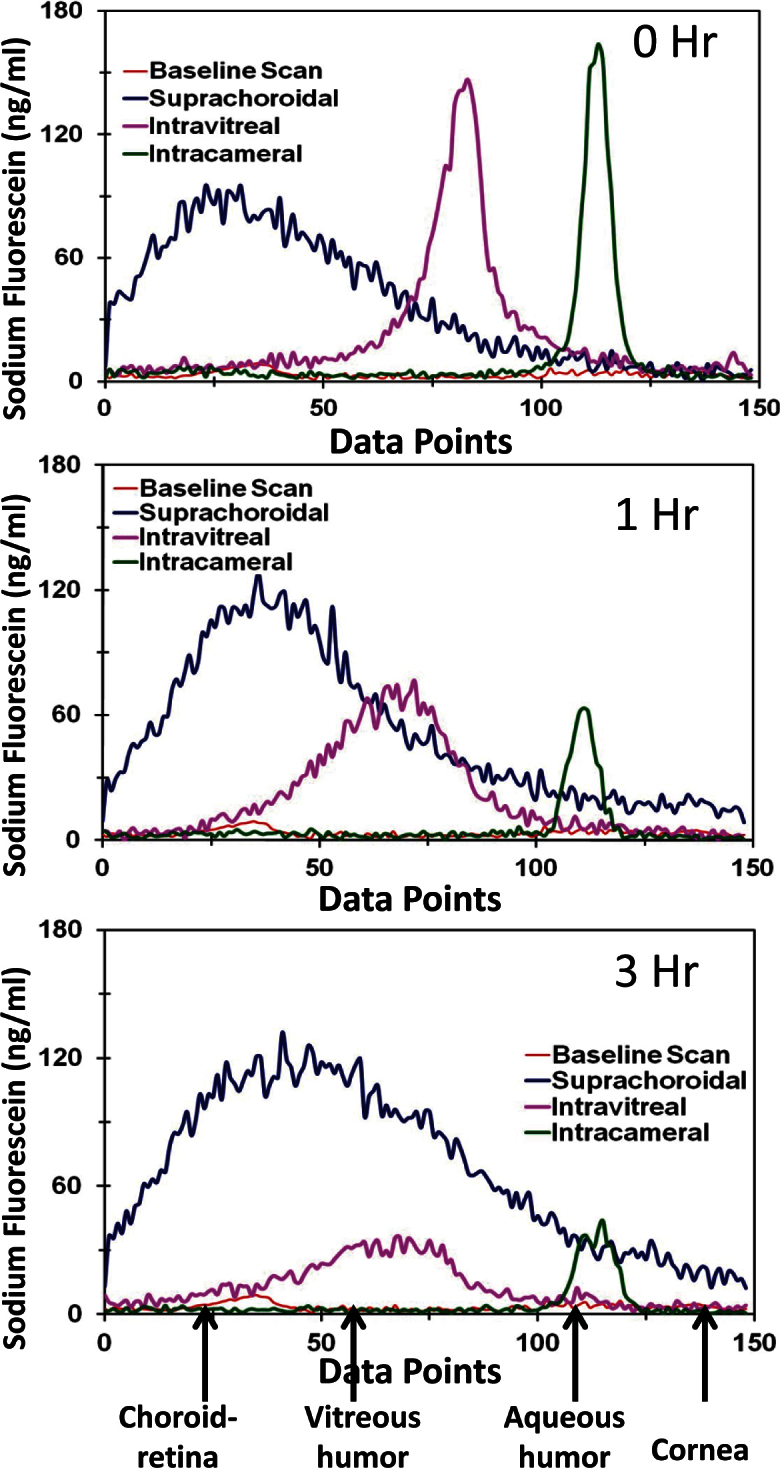
Fluorophotometry scans show sodium fluorescein levels at various depths of the eye along the visual axis. Representative fluorophotometry scans attained using Fluorotron Master™ in albino rabbit eyes after intracameral, intravitreal, and suprachoroidal injections of sodium fluorescein are shown. Scans were collected using Fluorotron Master at 0, 1, and 3 h post injection. Peaks for different regions were assigned from left to right at 20-30, 55-80, and 105-115 data points corresponding to choroid–retina, vitreous, and aqueous humor regions, respectively.