
Figure 3.
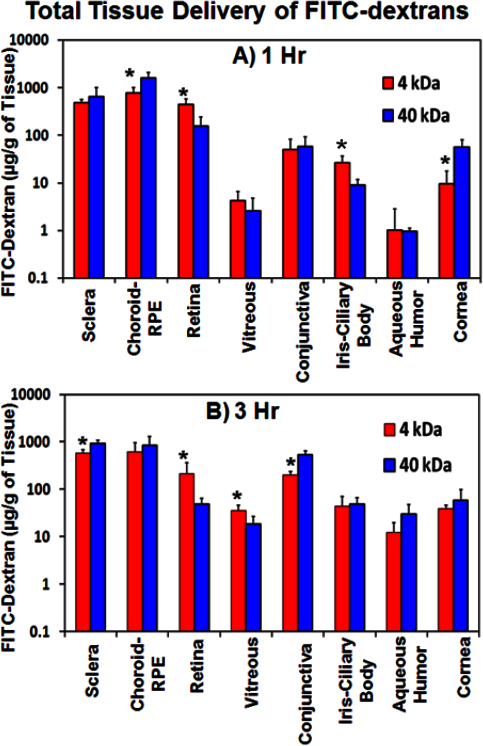
Total retinal and total vitreal delivery after suprachoroidal injection decreases with an increase in solute molecular weight. Ocular tissue distribution of fluorescein isothiocyanate (FITC)-dextran in ex vivo albino rabbit eyes at (A) 1 h and (B) 3 h after suprachoroidal is shown. Data is represented as mean ± standard deviation for n=4. * means the value is significantly different from FITC-dextran 40 kDa at p≤0.05.