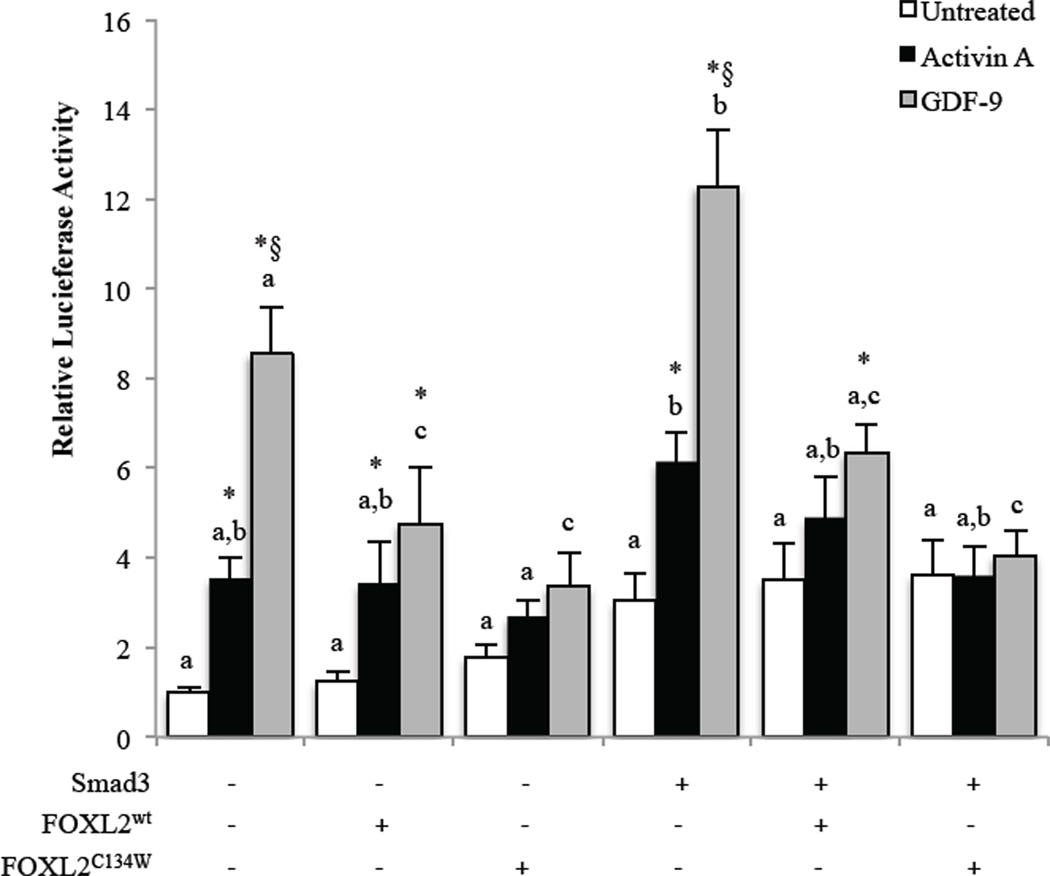
Figure 6. Effect of FOXL2wt and FOXL2C134W on Smad3 and activin or GDF-9-induced follistatin transcription in primary rat GCs.
GCs were transfected with a rat follistatin-luciferase reporter (rFS2.9i-luc) and the indicated FOXL2, FOXL2C134W mutant or Smad3 expression plasmids, then cultured overnight with fresh media before treatment the next day with vehicle (untreated), 100 ng/ml activin A or 300 ng/ml GDF-9 for 8 hr. Data are represented as the ratio of the normalized luciferase activity to the untreated no-expression plasmid group. Differences in activity were evaluated by a two-way ANOVA followed by Tukey’s posthoc analysis. * indicates a significant (p < 0.05) effect of treatment compared with untreated within each transfection condition. § indicates a significant (p < 0.05) difference between activin A and GDF-9 treatment within each transfection condition. Different letters indicate a significant difference (p < 0.05) between transfection conditions within each treatment. Each experiment contained triplicate wells and values shown are mean ± SEM of 5 replicate experiments.

