Abstract
CD44 and CD24 are important cell surface glycoproteins whose relative expression levels are used to identify so-called cancer stem cells (CSCs). While current diagnostic applications of CD44 and CD24 focus primarily on their expression levels, we demonstrate here that noble metal nanoparticle (NP) immunolabeling in combination with Plasmon Coupling Microscopy (PCM) can reveal more subtle differences, such as the spatial organization of these surface species on sub-diffraction limit length scales. We quantified both expression and spatial clustering of CD44 and CD24 on MCF7 and SKBR3 breast cancer cells through analysis of the labeling intensity and the electromagnetic coupling of the NP labels, respectively. The labeling intensity was well correlated with the receptor expression, but the inspection of the labeled cell surface in the optical microscope revealed that the NP immunolabels were not homogeneously distributed. Consistent with a heterogeneous spatial distribution of the targeted CD24 and CD44 in the plasma membrane, a significant fraction of the NPs were organized into clusters, which were easily detectable in the optical microscope as discrete spots with colors ranging from green to orange. To further quantify the spatial organization of the targeted proteins we characterized individual NP clusters through spatially resolved elastic scattering spectroscopy. The statistical analysis of the single cluster spectra revealed a higher clustering affinity for CD24 than for CD44 in the investigated cancer models. This preferential clustering was removed upon lipid raft disruption through cholesterol sequestration. Overall, these observations confirm a preferential enrichment of CD24 in lipid rafts and a more random distribution of CD44 in the plasma membrane as cause for the observed differences in protein clustering.
Keywords: Bioplasmonics, Lipid Rafts, Biomarkers, Glycoproteins, Plasma Membrane, Plasmon Coupling Microscopy, Immunophenotyping
The lateral organization of CD24 and CD44 plays an important role for their functionality. While the glycosyl phosphatidylinositol (GPI) linked sialoprotein CD24 is believed to preferentially localize in lipid rafts where it can affect the spatial distribution of other membrane components,1 CD44 has been characterized as a temporary raft residing protein whose translocation into lipid rafts2 can induce the formation of local signalling “hot-spots”.3–4 A direct experimental verification of the selective enrichment of CD24 in lipid rafts is challenged by the small sizes of these domains, which are typically smaller than the resolution limit of conventional light microscopy (~250 nm).5–6 We demonstrate in this work that 40 nm diameter Au immunolabels targeted at CD24 and CD44 do not only facilitate a rapid detection of CD44 and CD24 overexpression at the single cell level but also enable a quantitative characterization of the self-organization (“clustering”) of the proteins on the tens of nanometer length scale, resulting in a more complete characterization of cellular phenotypes. Since the clustering of cellular surface proteins plays an important role in the spatial regulation of signaling and cell-to-cell communication,7–8 the gain in information about the spatial organization of disease relevant surface proteins, such as CD24 and CD44, has tangible diagnostic and therapeutic implications.
The optical response of Au nanoparticle (NP) immunolabels is dominated by coherent collective electron oscillations, so called plasmons. Due to their large optical scattering cross-sections, individual Au nanoparticles with diameters larger than 20 nm,9 can be visualized in darkfield10–11 or differential interference contrast (DIC)12 microscopy. Electromagnetic interactions between the NP labels can provide additional quantitative cues about the spatial protein organization. Plasmon coupling between NPs separated by less than about one NP diameter leads to a measurable spectral red-shift of the plasmon resonance13–14 and, therefore, facilitates the detection of NP clusters in a cellular context both through elastic15–21 or inelastic22–24 light scattering. The magnitude of the spectral plasmon resonance shift upon NP clustering depends on the separation between the NPs,13–14, 25–27 the number and geometric arrangement of interacting NPs,28–33 and the ambient refractive index, nr34–35. The cluster size and separation dependence of the scattering spectra of NP immunolabels at constant nr forms the foundation for characterizing the spatial organization of cell surface moieties on nanometer to tens of nanometer length scales through spectral analysis of collective NP responses in Plasmon Coupling Microscopy (PCM).19–20, 36 We apply this all-optical approach herein to characterize the spatial distributions of CD24 and CD44 after immobilization in the plasma membranes of the in vitro breast cancer cell lines MCF7 and SKBR3 using standard formalin fixation procedures.37 Different from previous PCM studies,19–20 which relied on an averaging of the spectral content over large surface areas to characterize the large-scale association of the targeted proteins, the current work utilizes a statistical analysis of single cluster spectra. This approach has the advantage that variations in the shape and total intensity of the recorded scattering spectra provide quantitative measures for the variability of the size and average interparticle separation of individual clusters. This variability ultimately depends on the lateral heterogeneity of the targeted protein, whose spatial distribution in the membrane determines the local NP clustering.
We labeled CD24 and CD44 with Au NPs using previously established procedures.19 Briefly, 40 nm NPs were functionalized with 3.4 kDa thiolated polyethylene glycols (PEGs) that contained a terminal azide residue to facilitate an uncomplicated introduction of anti-biotin antibodies or Neutravidin (only for cholesterol extraction experiments) using the Cu+ catalyzed 1,3-dipolar cycloaddition (Figure S1).38 Then anti-CD24/CD44 IgG antibodies, biotinylated secondary antibodies, and anti-biotin antibody (or Neutravidin) functionalized NPs were applied onto cell membrane successively (see Figure S2 and Methods). The NP stability was tested before and after their incubation with cells, and these tests confirmed that the NPs were stable against spontaneous self-association under the chosen labeling conditions (Figure S3-4).
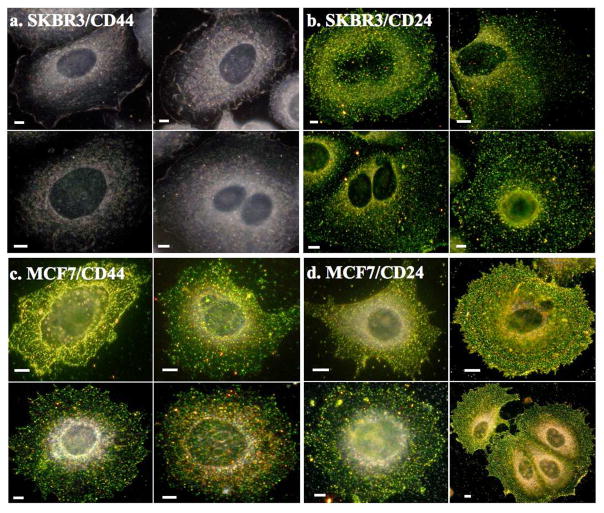
The developed NP immunolabels efficiently bound to their protein targets and indicated CD44 or CD24 overexpression by a vivid coloring of the labeled cells (Figure 1). The NP labeling experiments confirm the CD44+/CD24+ phenotype for MCF7 and CD44−/CD24+ for SKBR3, which is consistent with flow cytometry measurements (Figure S5) and recent reports39.
Figure 1.
40 nm Au NP immunolabeling facilitates surface expression profiling of CD44 and CD24 on SKBR3 and MCF7 cells. Darkfield scattering images of SKBR3 cells labeled for a) CD44 and b) CD24, and MCF7 cells labeled for c) CD 44 and d) CD24. Scale bars are 5μm
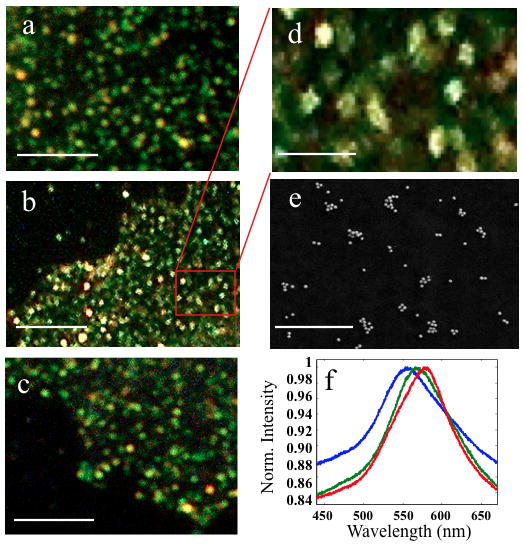
A close inspection of the darkfield scattering images of SKBR3/CD24, MCF7/CD24, and MCF7/CD44 (Figure 2a–c) shows that the NP labeling leads to a discrete spotting of the cell surface, where each spot belongs to one or several NPs. Taking advantage of the strong distance dependence of plasmon coupling on a length scale of up to approximately one NP diameter, additional information about the number and spatial distribution of NPs within individual diffraction limited spots can be obtained through analysis of their spectra. A color that is significantly red-shifted relative to the vivid green of individual Au NPs indicates a local clustering of the labels. The magnified views of NP labeled SKBR3/CD24, MCF7/CD24, and MCF7/CD44 cell surfaces in Figure 2a–c show that - consistent with locally varying degrees of NP clustering - all cell/protein combinations exhibit a heterogeneous distribution of colors.
Figure 2.

Au NP immunolabels form discrete spots on the cell membrane for different cell/protein targets: a) SKBR3/CD24, b) MCF7/CD24, c) MCF7/CD44. The magnified view in d) further emphasizes the “spotting” after labeling with NPs. e) SEM imaging confirms the organization of the cell-bound NPs into clusters of varying sizes (here for MCF7/CD24). f) Exemplary spectra of individual spots on the cell surface. Size bars are 5μm for a–c), 1μm for d–e).
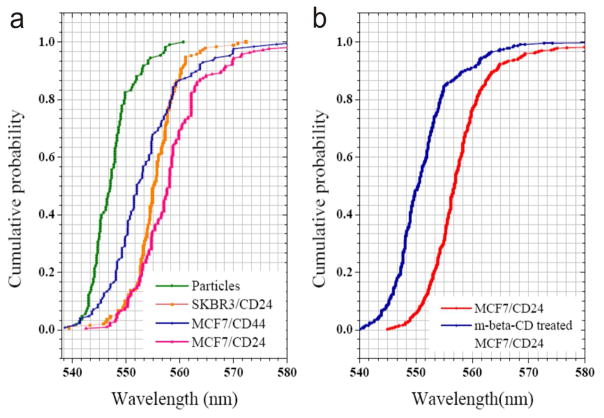
In Figure 2d&e we show a section of the NP labeled MCF7/CD24 sample at an even higher magnification and a randomly chosen SEM image of the same sample. Both images confirm the heterogeneous distribution of the NP labels and their organization into discrete clusters. While the 40 nm NPs used in this work are too large to assume targeting of individual surface proteins, the observed NP immunolabel clusters indicate membrane domains with lateral dimensions of tens to hundreds of nanometers that are enriched in target proteins due to the large-scale organization of the proteins in the membrane. To further characterize and compare CD24 and CD44 clustering on MCF7 and SKBR3, we recorded elastic scattering spectra of ~200 randomly chosen NP spots for each cell/protein concentration and determined the peak wavelengths (λres) of the measured spectra (Figure 2f). The experimental set-up and the spatially resolved data acquisition approach are illustrated in Figure S6 and described in the Methods section of the Supporting Information. The resulting λres distributions of MCF7/CD44, SKBR3/CD24, and MCF7/CD24 are all significantly (p < 0.001, 2-side Student’s t-test) red- shifted (Figure 3a) when compared with the λres distribution of randomly distributed Au NP immunolabels immersed in a glycerol solution with refractive index of nr = 1.40 (see Methods). This comparison indicates that the spatial CD24 and CD44 distribution induces the NP clustering on the cell surface. We did not include SKBR3/CD44 in this analysis, as the binding was too low (Figure 1a). The average resonance wavelengths (λav ± standard deviation) for CD24 on SKBR3 and MCF7, respectively, are λav = 555.4 nm ± 4.6 nm and 558.5 nm ± 7.8nm, and for MCF7/CD44, λav = 553.6 ± 7.4 nm, which compares with λav = 547.4 ± 4.0 nm for the Au NPs control. The observed shifts in the λres distributions in Figure 3a show that the CD24 labeled cells contain more clusters with more strongly coupled NPs than observed for CD44 (p<0.001 for MCF7/CD24 and MCF7/CD44). This finding is consistent with a stronger clustering of CD24 in the plasma membrane. We emphasize that the clustering of CD24 and the spatial separation between the clusters observed in Figure 2d&e is in good agreement with previously observed distribution patterns of cholesterol enriched domains using superresolution fluorescence microscopy.40
Figure 3.
Characterization of NP clustering through spectral analysis. a) Cumulative distribution plots of the fitted peak resonance wavelength (λres) of 40 nm Au NPs in an ambient refractive index of nr = 1.40 and targeted at CD24 and CD44 on MCF7 and SKBR3 cells in HBSS. b) Cumulative distribution plots of λres for NPs targeted at MCF7/CD24 before (red) and after (blue) treatment with m-β-CD. For each individual condition approximately 200 individual measurements were evaluated in a) and 400 in b). Histograms of the fitted peak resonance wavelengths are included in Figure S7.
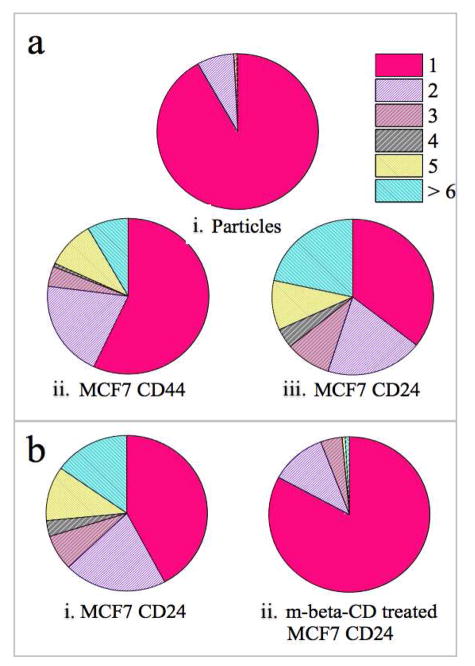
We validated the findings of our optical measurements by analyzing the clustering of NP labels targeted at CD24 and CD44 on MCF7 cells through SEM in Figure 4a. We analyzed the association of NPs into clusters for a total of 1500 – 2500 NPs on 13 cell surfaces obtained in 2 independent labeling experiments for each cell/protein pair. We also included the distribution obtained for anti-biotin functionalized NP immunolabels (recovered from solution after incubating with the cells) randomly deposited on the substrate as control to verify the stability of the NP immunolabels under the chosen experimental conditions. While > 91% of the NP immunolabels are monomeric, for both MCF7/CD24 and MCF7/CD44 we found a significant degree of NP clustering. Furthermore, the SEM data confirms a higher degree of clustering for CD24 than for CD44. In the case of MCF7/CD24 64% of the NPs are organized into clusters, and 22% formed clusters larger than pentamers. In contrast, for MCF7/CD44 57% of the NPs are still monomers, and only 5% form clusters larger than pentamers. The quantitative SEM analysis reproduces the trends form our spectral analysis; the cell surface induces a patterning of NP immunolabels through heterogeneous distribution of both biomarkers, but CD24 is more strongly clustered than CD44.
Figure 4.
SEM characterization of NP cluster size distributions. Size distribution of a-i) randomly immobilized Au NP immunolabels collected after incubation with cells, a-ii) Au NPs targeted at CD44 on MCF7 cells, and a-iii) Au NPs targeted at CD24 on MCF7 cells. b) Neutravidin funtionalized Au NP cluster size distributions before (b-i) and after (b-ii) m-β-CD treatment of MCF7/CD24. The numerical percentages of each section are summarized in Tables S1&2.
One possible explanation for the observed differences in clustering between CD24 and CD44 is the preferential enrichment of CD24 in confined membrane domains, such as lipid rafts. We hypothesized that if lipid rafts play an essential role in structuring cell surface CD24, then a lipid raft disruption, for instance, through methyl-β-cyclodextrin (m-β-CD),41–42 should remove the preferential NP clustering. To test this hypothesis, we compared the spectral distributions of NP labels targeted at MCF7/CD24 before and after m-β-CD treatment. Different from the previous experiments we used Neutravidin instead of anti-Biotin antibody functionalized NPs for labeling CD24 under otherwise identical conditions. We changed to Neutravidin in these experiments since it provided comparable labeling results at much lower cost than the antibodies. We recorded spectra of ~400 individual scatterers for each condition (with/without m-β-CD) from randomly chosen flat peripheral membrane areas in 2 independent experiments. The distribution of the peak wavelength λres is shown in Figure 3b. The λres distribution for the cholesterol depleted cells is significantly (p < 0.001) blue-shifted when compared with the untreated cells. The average resonance wavelengths for CD24 on MCF7 and cholesterol depleted MCF7 cells are 557.8±7.0 and 551.2±5.8, respectively.
While the cell surface expression levels remained unchanged before and after m-β-CD treatment through flow cytometry (data not show), the cluster size distributions obtained from SEM analysis (Figure 4b), confirmed that cholesterol extraction through m-β-CD leads to a decrease in NP clustering. The observed differences in the clustering of CD24 bound NPs (at constant CD24 cell surface concentration) prove a substantial spatial reorganization of CD24 due to cholesterol sequestration. Our findings confirm the hypothesis that the observed clustering arises from a preferential enrichment of CD24 in lipid rafts.
In conclusion, we demonstrated that Au NP immunolabels facilitate an optical quantification of the relative expression and large scale association levels of CD24 and CD44. A systematic analysis of the spectral responses of NP immunolabels selectively targeted at CD24 and CD44 in MCF7 cells revealed a higher degree of clustering for CD24 than for CD44. After cholesterol sequestration the CD24 spectral response was comparable to that of CD44, confirming that CD24 clustering is caused by a preferential recruitment of CD24 into cholesterol enriched membrane domains. Since the recruitment of CD24 in lipid rafts is anticipated to impact its biological function in cell adhesion and cell signaling through a local concentration effect, the ability to quantify both concentration and lateral spatial heterogeneity provides a more complete description of its surface presentation than is available through conventional (i.e. expression-level based) phenotyping approaches. The plasmon coupling based characterization of individual NP immunolabel clusters introduced herein facilitates the correlation of cell behavior and protein spatial organization and provides, therefore, opportunities for improving the reliability of CD24 and CD44 as biomarkers for cancer stem cell detection and other applications.
Supplementary Material
Acknowledgments
Funding Sources
This work was supported by the National Institutes of Health (NHI/NCI) through Grant 5R01CA138509-04 and the National Science Foundation (NSF) through Grant CBET-0953121.
ABBREVIATIONS
- PCM
Plasmon Coupling Microscopy
- NP
nanoparticle
- SEM
Scanning electron microscope
- m-β-CD
Methyl-β-cyclodextrin
Footnotes
Author Contributions
The manuscript was written through contributions of all authors. All authors have given approval to the final version of the manuscript.
Supporting Information. Figures S1-7, Tables S1&2 and Methods Section. This material is available free of charge via the Internet at http://pubs.acs.org.
References
- 1.Runz S, Mierke CT, Joumaa S, Behrens J, Fabry B, Altevogt P. Biochem Bioph Res Co. 2008;365(1):35–41. doi: 10.1016/j.bbrc.2007.10.139. [DOI] [PubMed] [Google Scholar]
- 2.Lingwood D, Simons K. Science. 2010;327(5961):46–50. doi: 10.1126/science.1174621. [DOI] [PubMed] [Google Scholar]
- 3.Lee JL, Wang MJ, Sudhir PR, Chen JY. Mol Cell Biol. 2008;28(18):5710–23. doi: 10.1128/MCB.00186-08. [DOI] [PMC free article] [PubMed] [Google Scholar]
- 4.Ghatak S, Misra S, Toole BP. J Biol Chem. 2005;280(10):8875–83. doi: 10.1074/jbc.M410882200. [DOI] [PubMed] [Google Scholar]
- 5.de Almeida RF, Loura LM, Fedorov A, Prieto M. J Mol Biol. 2005;346(4):1109–20. doi: 10.1016/j.jmb.2004.12.026. [DOI] [PubMed] [Google Scholar]
- 6.Cambi A, Lidke DS. ACS Chem Biol. 2012;7(1):139–149. doi: 10.1021/cb200326g. [DOI] [PMC free article] [PubMed] [Google Scholar]
- 7.Simons K, Toomre D. Nat Rev Mol Cell Biol. 2000;1:31–39. doi: 10.1038/35036052. [DOI] [PubMed] [Google Scholar]
- 8.Schwarz-Romond T, Gorski SA. The Embo Journal. 2010;29:2675–2676. doi: 10.1038/emboj.2010.185. [DOI] [PMC free article] [PubMed] [Google Scholar]
- 9.Yguerabide J, Yguerabide EE. Anal Biochem. 1998;262(2):157–76. doi: 10.1006/abio.1998.2760. [DOI] [PubMed] [Google Scholar]
- 10.Schultz S, Smith DR, Mock JJ, Schultz DA. Proc Natl Acad Sci U S A. 2000;97(3):996–1001. doi: 10.1073/pnas.97.3.996. [DOI] [PMC free article] [PubMed] [Google Scholar]
- 11.Sonnichsen C, Franzl T, Wilk T, von Plessen G, Feldmann J, Wilson O, Mulvaney P. Phys Rev Lett. 2002;88(7):077402. doi: 10.1103/PhysRevLett.88.077402. [DOI] [PubMed] [Google Scholar]
- 12.Gu Y, Di X, Sun W, Wang G, Fang N. Anal Chem. 2012;84(9):4111–4117. doi: 10.1021/ac300249d. [DOI] [PubMed] [Google Scholar]
- 13.Reinhard BM, Siu M, Agarwal H, Alivisatos AP, Liphardt J. Nano Lett. 2005;5(11):2246–2252. doi: 10.1021/nl051592s. [DOI] [PubMed] [Google Scholar]
- 14.Yang LL, Wang HY, Yan B, Reinhard BM. J Phys Chem C. 2010;114(11):4901–4908. doi: 10.1021/jp911858v. [DOI] [PMC free article] [PubMed] [Google Scholar]
- 15.Wax A, Sokolov K. Laser Photonics Rev. 2009;3(1–2):146–158. [Google Scholar]
- 16.Austin LA, Kang B, Yen CW, El-Sayed MA. J Am Chem Soc. 2011;133(44):17594–17597. doi: 10.1021/ja207807t. [DOI] [PMC free article] [PubMed] [Google Scholar]
- 17.Wang H, Wu L, Reinhard BM. ACS Nano. 2012;6(8):7122–7132. doi: 10.1021/nn302186n. [DOI] [PMC free article] [PubMed] [Google Scholar]
- 18.Rong GX, Wang HY, Skewis LR, Reinhard BM. Nano Lett. 2008;8(10):3386–3393. doi: 10.1021/nl802058q. [DOI] [PMC free article] [PubMed] [Google Scholar]
- 19.Wang J, Boriskina SV, Wang H, Reinhard BM. ACS Nano. 2011;5(8):6619–6628. doi: 10.1021/nn202055b. [DOI] [PMC free article] [PubMed] [Google Scholar]
- 20.Wang J, Yu XW, Boriskina SV, Reinhard BM. Nano Lett. 2012;12(6):3231–3237. doi: 10.1021/nl3012227. [DOI] [PMC free article] [PubMed] [Google Scholar]
- 21.Aaron J, Travis K, Harrison N, Sokolov K. Nano Lett. 2009;9(10):3612–3618. doi: 10.1021/nl9018275. [DOI] [PMC free article] [PubMed] [Google Scholar]
- 22.Hu QY, Tay LL, Noestheden M, Pezacki JP. J Am Chem Soc. 2007;129(1):14–15. doi: 10.1021/ja0670005. [DOI] [PubMed] [Google Scholar]
- 23.Kennedy DC, Tay LL, Lyn RK, Rouleau Y, Hulse J, Pezacki JP. ACS Nano. 2009;3(8):2329–2339. doi: 10.1021/nn900488u. [DOI] [PubMed] [Google Scholar]
- 24.Lee K, Drachev VP, Irudayaraj J. ACS Nano. 2011;5(3):2109–2117. doi: 10.1021/nn1030862. [DOI] [PubMed] [Google Scholar]
- 25.Jain PK, Huang W, El-Sayed MA. Nano Lett. 2007;7(7):2080–2088. doi: 10.1021/nl071813p. [DOI] [PubMed] [Google Scholar]
- 26.Wei QH, Su KH, Durant S, Zhang X. Nano Lett. 2004;4(6):1067–1071. [Google Scholar]
- 27.He L, Smith EA, Natan MJ, Keating CD. J Phys Chem B. 2004;108(30):10973–10980. [Google Scholar]
- 28.Yan B, Boriskina SV, Reinhard BM. J Phys Chem C. 2011;115(50):24437–24453. doi: 10.1021/jp207821t. [DOI] [PMC free article] [PubMed] [Google Scholar]
- 29.Fan JA, Wu CH, Bao K, Bao JM, Bardhan R, Halas NJ, Manoharan VN, Nordlander P, Shvets G, Capasso F. Science. 2010;328(5982):1135–1138. doi: 10.1126/science.1187949. [DOI] [PubMed] [Google Scholar]
- 30.Ko H, Singamaneni S, Tsukruk VV. Small. 2008;4(10):1576–1599. doi: 10.1002/smll.200800337. [DOI] [PubMed] [Google Scholar]
- 31.Stranahan SM, Titus EJ, Willets KA. ACS Nano. 2012;6(2):1806–1813. doi: 10.1021/nn204866c. [DOI] [PubMed] [Google Scholar]
- 32.Liu N, Hentschel M, Weiss T, Alivisatos AP, Giessen H. Science. 2011;332(6036):1407–1410. doi: 10.1126/science.1199958. [DOI] [PubMed] [Google Scholar]
- 33.Yan B, Boriskina SV, Reinhard BM. J Phys Chem C. 2011;115(11):4578–4583. doi: 10.1021/jp112146d. [DOI] [PMC free article] [PubMed] [Google Scholar]
- 34.Wang HY, Reinhard BM. J Phys Chem C. 2009;113(26):11215–11222. doi: 10.1021/jp900874n. [DOI] [PMC free article] [PubMed] [Google Scholar]
- 35.Jain PK, El-Sayed MA. Nano Letters. 2008;8(12):4347–4352. doi: 10.1021/nl8021835. [DOI] [PubMed] [Google Scholar]
- 36.Wang HY, Rong GX, Yan B, Yang LL, Reinhard BM. Nano Lett. 2011;11(2):498–504. doi: 10.1021/nl103315t. [DOI] [PMC free article] [PubMed] [Google Scholar]
- 37.Wilson BS, Pfeiffer JR, Raymond-Stinz MA, Lidke DS, Lidke KA, Andrews N, Oliver JM. Method Mol Biol. Vol. 398. Humana Press; 2007. pp. 247–263. [Google Scholar]
- 38.Kolb HC, Finn MG, Sharpless KB. Angew Chem Int Edit. 2001;40(11):2004–2021. doi: 10.1002/1521-3773(20010601)40:11<2004::AID-ANIE2004>3.0.CO;2-5. [DOI] [PubMed] [Google Scholar]
- 39.Calcagno AM, Salcido CD, Gillet JP, Wu CP, Fostel JM, Mumau MD, Gottesman MM, Varticovski L, Ambudkar SV. J Natl Cancer I. 2010;102(21):1637–1652. doi: 10.1093/jnci/djq361. [DOI] [PMC free article] [PubMed] [Google Scholar]
- 40.Mizuno H, Abe M, Dedecker P, Makino A, Rocha S, Ohno-Iwashita Y, Hofkens J, Kobayashi T, Miyawaki A. Chem Sci. 2011;2(8):1548–1553. [Google Scholar]
- 41.Ohtani Y, Irie T, Uekama K, Fukunaga K, Pitha J. Eur J Biochem. 1989;186:17–22. doi: 10.1111/j.1432-1033.1989.tb15171.x. [DOI] [PubMed] [Google Scholar]
- 42.Zidovetzki R, Levitan I. Biochim Biophys Acta. 2007;1768:1311–1324. doi: 10.1016/j.bbamem.2007.03.026. [DOI] [PMC free article] [PubMed] [Google Scholar]
Associated Data
This section collects any data citations, data availability statements, or supplementary materials included in this article.


