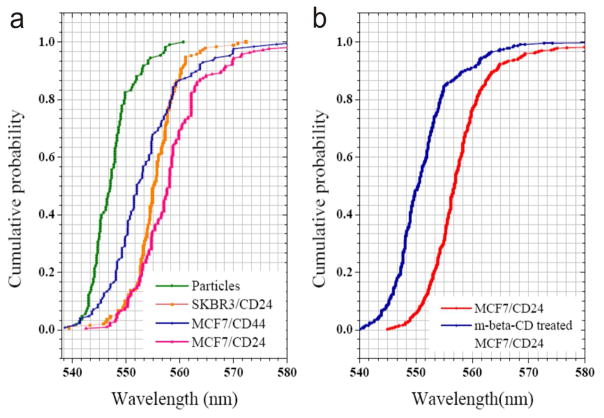
Figure 3.
Characterization of NP clustering through spectral analysis. a) Cumulative distribution plots of the fitted peak resonance wavelength (λres) of 40 nm Au NPs in an ambient refractive index of nr = 1.40 and targeted at CD24 and CD44 on MCF7 and SKBR3 cells in HBSS. b) Cumulative distribution plots of λres for NPs targeted at MCF7/CD24 before (red) and after (blue) treatment with m-β-CD. For each individual condition approximately 200 individual measurements were evaluated in a) and 400 in b). Histograms of the fitted peak resonance wavelengths are included in Figure S7.

