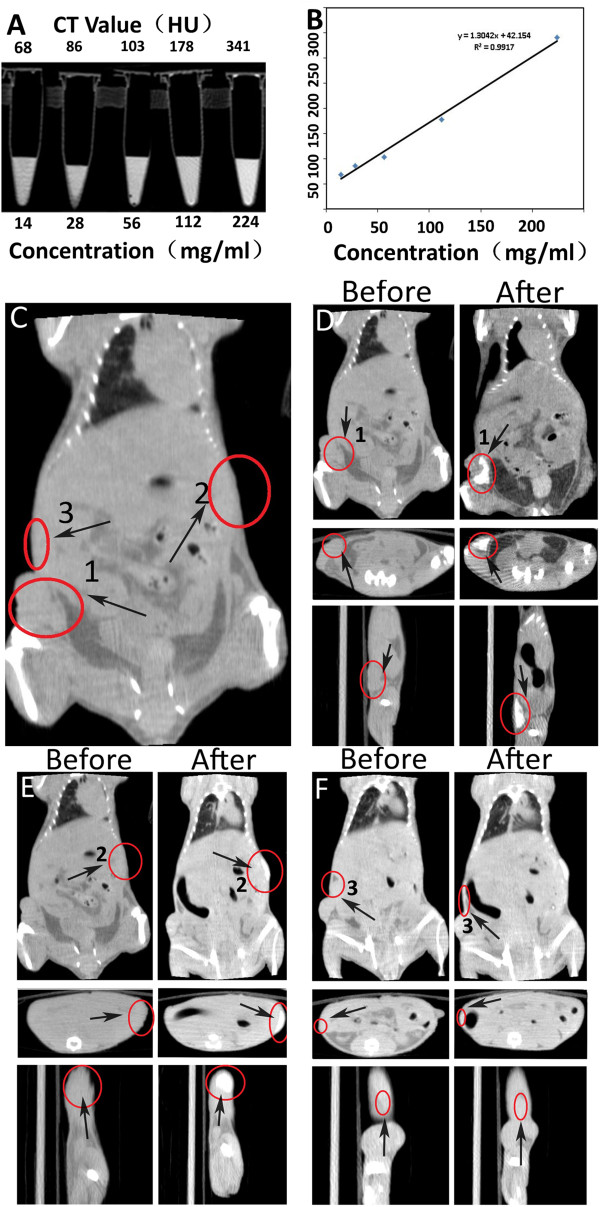
Figure 7.
AuNCs@SiO2-FA nanoprobes for CT imaging. (A) In vitro CT images of AuNCs@SiO2-FA in 0.01 M PBS. The concentration (mg/mL) in each sample is provided at the bottom of the respective images; (B) CT attenuation (HU) plot of AuNCs@SiO2-FA at various concentrations in the range from 14 to 226 mg/ml. In vivo CT images of nude models before and after tail vein and subcutaneous local injection: (C) showed the two different sites and the control site, named area-1(tumor site), area-2(back site), area-3 (soft tissue), respectively; (D) and (E) showed the CT images before and after tail vein and subcutaneous injection of area-1 and area-2 respectively. (F) area-3 soft tissue was selected as a control to area-1 and area-2.

