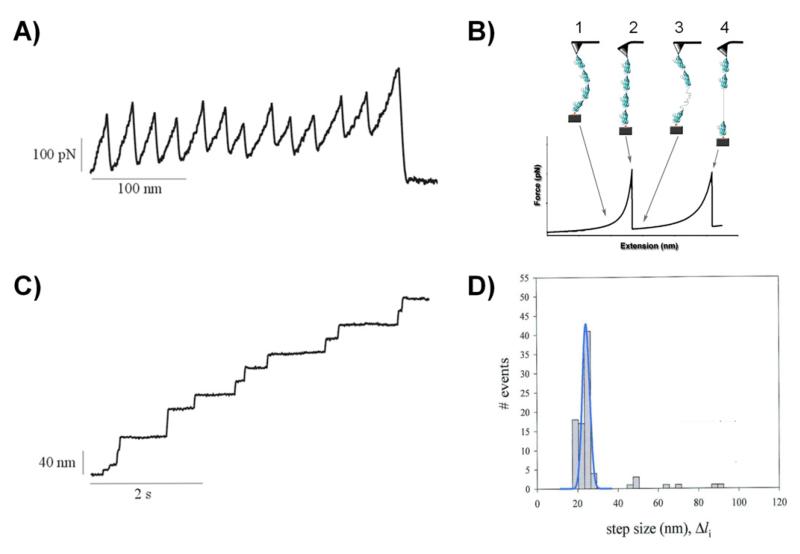
Figure 2. Protein unfolding events captured with length- and force-clamp AFM.
A) Example of single protein unfolding events observed using AFM in length-clamp mode (A) and a force-clamp mode (C). A) In the length-clamp mode each force peak corresponds to the unfolding of individual domains. The recorded force-extension curve resembles a “sawtooth” pattern. Each force peak corresponds to the unfolding of a single protein domain. The spacing between force-peaks is related to the length of the polypeptide chain upon domain unfolding. In the case of the titin I27 domain the measured increase in contour length is about 28 nm which correspond to the unraveling of about 75 amino acids that were packed into core of the domain (128). The last peak shows the detachment of the protein from the cantilever. The unfolding peaks in the sawtooth pattern vary randomly in amplitude with an average value of ~200 pN which is a result of stochastic nature of the unfolding process of single domains. B) Cartoon diagram showing the different steps during the mechanical unfolding of a domain in a polyprotein. The AFM tip picks up a single protein (1) and starts pulling on it (2). When sufficient force is applied (around 200pN) the domains begin to unfold (3) until it’s fully unfolded and reaches its maximum extension length (4). C) In the force-clamp mode the applied force is constant. The polyprotein unfolding resembles “staircase” pattern. Here each step of the extension-time curve corresponds to individual unfolding events and shows increases in the length of the protein. D) Frequency histogram of step sizes for the titin polyprotein (n = 99). The main peak is centered at 22.4 nm. Three minor peaks have average step size of about 48, 67, and 89 nm. The data were obtained at constant force of 147 pN. Reproduced with permission from (84).

