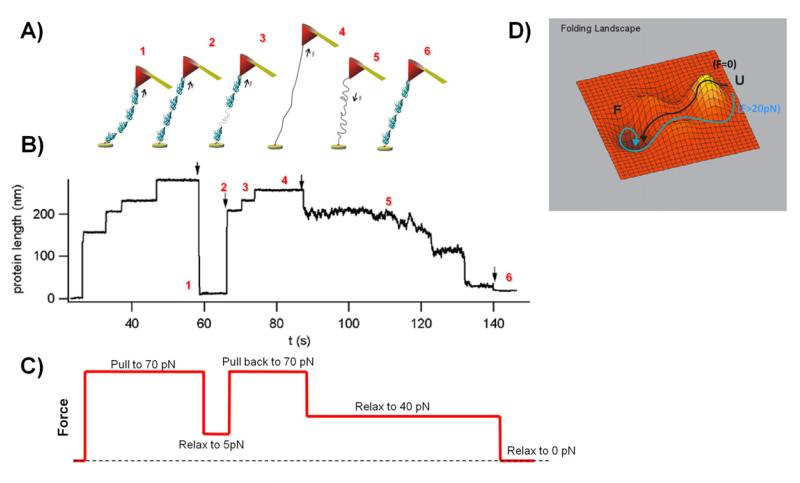
Figure 5. Collapse of unfolded protein domains under force.
A) Cartoon representation of a projectin single molecule held under different force values. The cantilever is brought into a contact with a polyprotein (1), and then force is applied on the molecule (2). Protein domains start unfolding (3) until all of them are unfolded and protein reaches its maximum length (4). Then the force is released (5) until domains will refold to their native states. The cantilever was drawn at an angle for illustration purposes only. B) and C) In this experiment the protein was unfolded and extended at high force 70 pN. The observed steps correspond to the unfolding of several domains. Then the force was dropped to about 5 pN (marked by arrow); after 6 seconds the force was increased to 70 pN and, and after another 15 seconds it was lowered to 40 pN and finally to 0 pN. The applied force is shown in C). Reproduced with permission from (100). D) Schematic representation of the folding energy landscape under a stretching force (pathway in cyan) and no applied force (pathway in black). The diagram represents mapping of a possible conformations of a protein and their corresponding levels of Gibbs free energy. The protein’s folded state corresponds to its free energy minimum.

