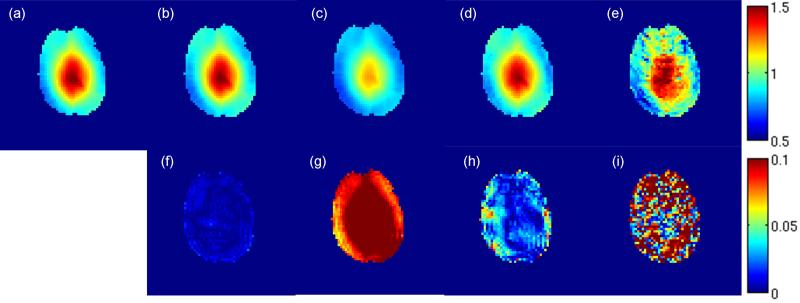
Figure 3.
Single slice in vivo BS mapping: (a) reference B1 map acquired by 8kHz Fermi pulse with 10 averages; relative B1 map (b-e) acquired with 500Hz QDAPX pulse (scaled from 50% to 150%) and corresponding relative error map in B1 (f-i) (scaled from 0% to 10%). (b,f) acquired with γB1p/ωRF=1.54 and optimized crusher, with B1 calculated using ϕ2BS-B1 curve; (c,g) acquired with γB1p/ωRF=1.54 and sufficient crusher, with B1 calculated using original equation proposed in (5); (d,h) acquired with γB1p/ωRF=0.37 and sufficient crusher, with B1 calculated using original equation proposed in (5); (e,i) acquired with γB1p/ωRF=0.37 without any crusher (as in (5)), with B1 calculated using original equation proposed in (5).

