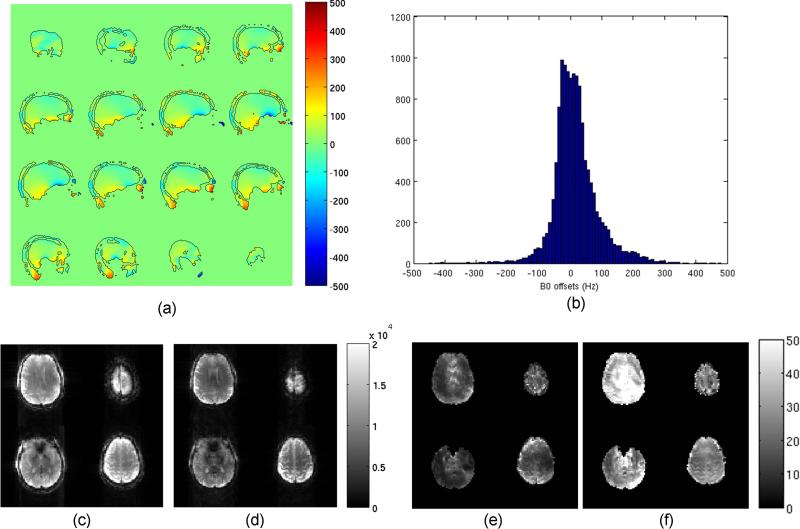
Figure 5.
Multi-slice OBS mapping: (a) multi-slice B0 offset map (scaled from -500Hz to 500Hz), with the boundaries of the mask delineated by black lines; (b) corresponding histogram of B0 offset; (c,d) magnitude images (in arbitrary units) after 10 averages acquired by the B1 sequences using (c) Fermi pulse (ΔfRF=8kHz) and (d) QDAPX pulse (ΔfRF=500Hz) at the same SAR level (98% of maximum) and minimum TE, scaling from 0 to 20,000; (e,f) corresponding ANR images for (e) Fermi pulse and (f) QDAPX pulse respectively, scaling from 0 to 50.

