
Figure 3. Biodistribution of surface-modified NPs.
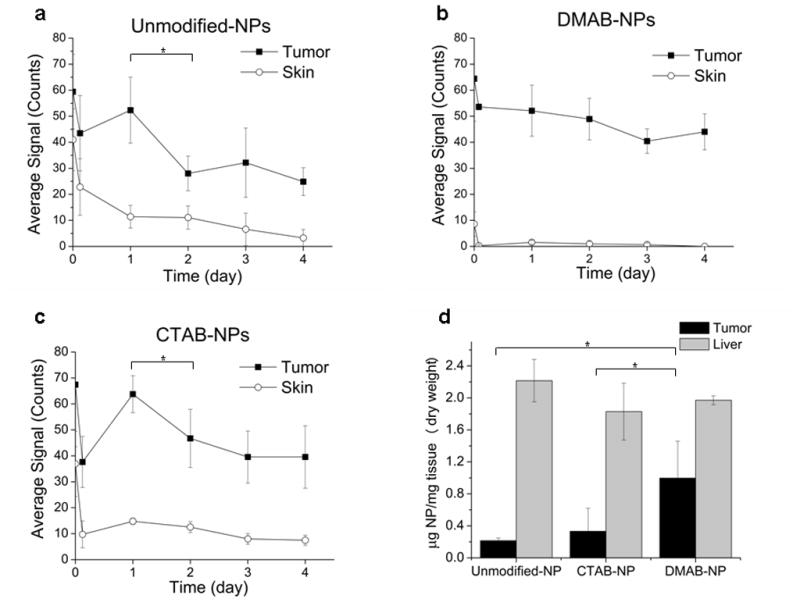
In vivo NIR signal from the tumor and from a skin region further away from the tumor (background tissue signal) was monitored over 4 days after injection of NIR-dye loaded unmodified NPs (a), DMAB-NPs (b), and CTAB-NPs (c); n = 3–4. Statistical analysis was performed on tumor signal with skin signal subtracted (*p<0.05). Quantification of NPs in tumor and liver for each group was also performed ex vivo 48 hrs post-injection (d, *p< 0.05).