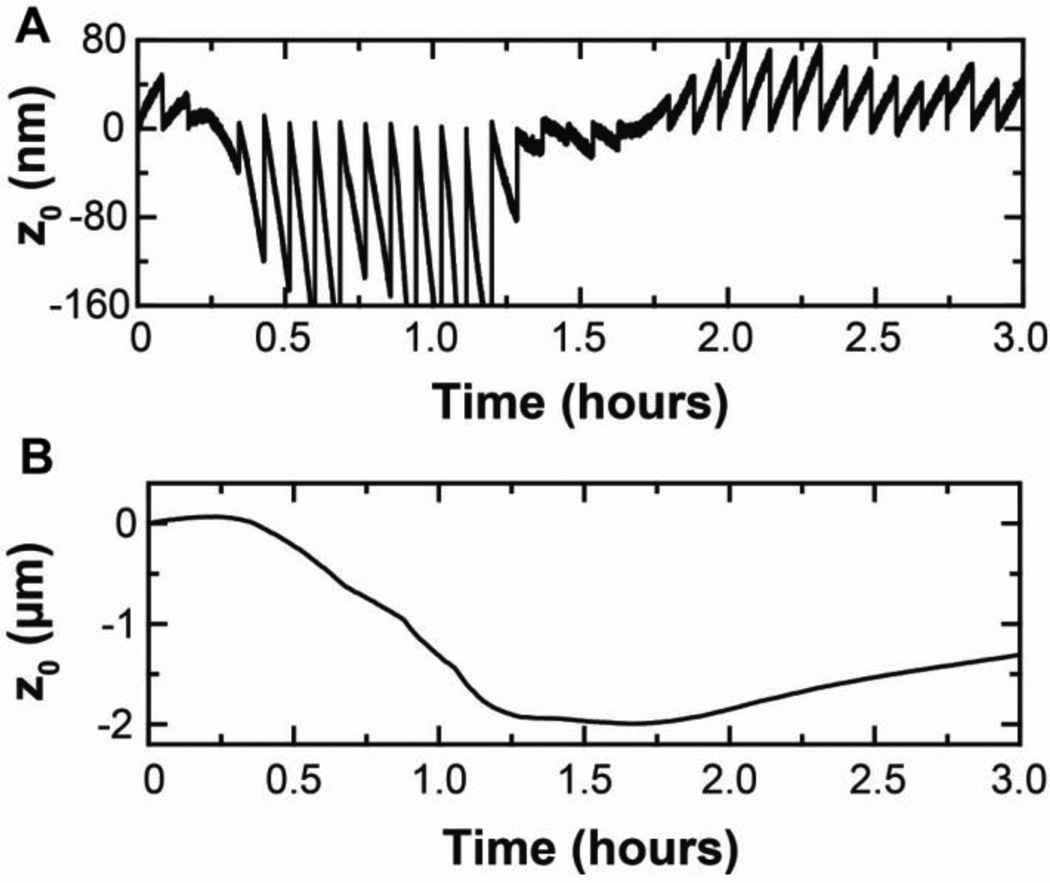
Fig. 3.
Data acquisition and analysis. (A) Representative raw drift trace of a gold-coated long BioLever. The discontinuities in the trace represent re-zeroing of the QPD every 5 min. (B) Continuous trace corresponding to the raw drift trace shown in (A) was generated after applying our simple splicing algorithm. This figure is extracted from [5] with permission from the American Chemical Society.

