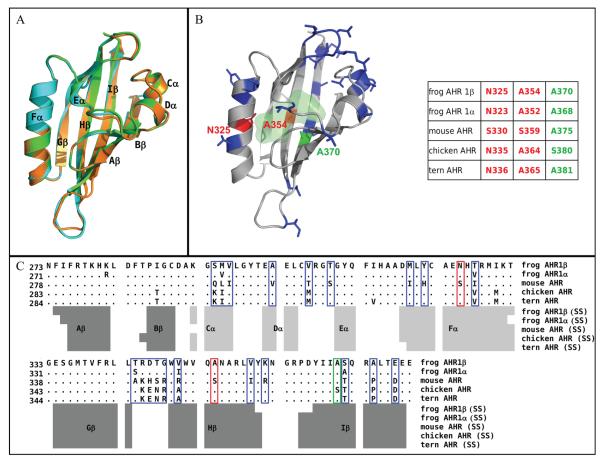
Figure 2. Homology model for the frog AHR1β LBD.
(A) Comparison of cartoon renderings for modeled LBDs of frog and mouse AHR. Green, mouse AHR; cyan, frog AHR1α; orange, frog AHR1β. Black labels indicate the conserved secondary structure elements attributed by DSSPcont. (B) Cartoon representation of the modeled AHR1β LBD. Residues highlighted in red (N325 and A354) represent positions that differ between frog and mouse and protrude into the modeled binding cavity. These were mutated individually and in combination in these studies. Residues highlighted in blue differ between frog and mouse, but they do not point into the binding cavity. The residue highlighted in green (A370) plays an important role in determining the binding affinity of human, mouse, and bird AHRs. The light green shaded area indicates the molecular surface of the binding cavity of frog AHR1β identified by CASTp. The numbering of the three mutated residues in all the indicated AHR sequences is reported in the scheme for comparative purposes. (C) Sequence alignment of the indicated AHR LBDs, obtained by ClustalW. Only the residues that differ from the reference mouse AHR sequence are shown, while dots indicate the conserved positions. Variable residues are boxed, using the same color scheme as in panel B. Secondary structures attributed to the homology models by DSSPcont are indicated below: light grey bars for helices and dark grey bars for β-strands.

