
Figure 7.
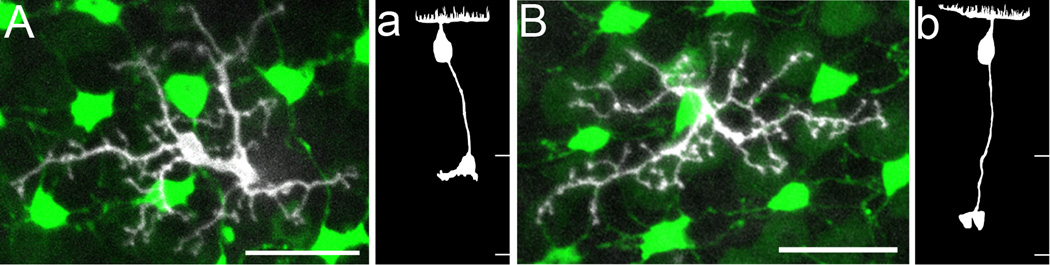
Two RGRod bipolar cells with the same dendritic tree morphology and similar soma depth and size but different axonal stratification in SWS1-GFP:LWS-GFP double transgenic zebrafish retinas, in which UV and R cone terminals have bright and dim fluorescence, respectively. A,B: The z-axis projection of serial confocal images of the dendritic tree and corresponding photoreceptor terminals. a,b: Drawings in the radial plane of the bipolar cells in A and B, respectively. Borders for the IPL are marked by white lines. See text for details. Scale bars = 10 µm in A,B.