Fig. 2.
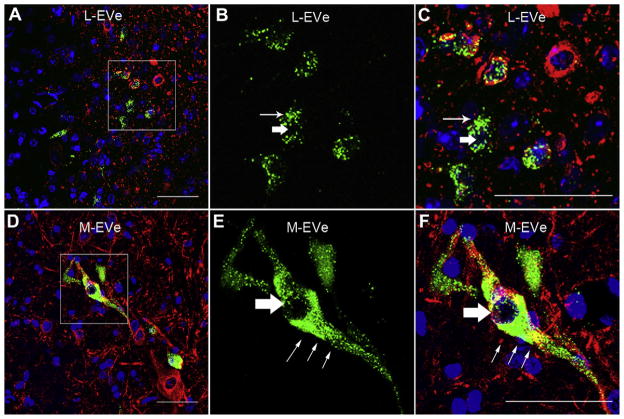
Gentamicin immunolabeling in the L-EVe and M-EVe 7 days following transtympanic administration. (A) Gentamicin immunolabeling (green) in the ipsilateral L-EVe 3 days after transtympanic injection. Blue represents DAPI labeling of ds-DNA in the nuclei of cells and red represents specific beta-III tubulin immunolabeling in neurons. (B) Magnified image of the boxed area in A for gentamicin immunofluorescence only. Labeling is intense and punctate within the cytoplasm (thin arrow in B and C) but not in nucleus (thick arrow in B and C) of neurons. (C) Magnified image of the boxed area in (A) for all three fluorophores. (D) Ipsilateral M-EVe 3 days after transtympanic gentamicin treatment. One bipolar neuron showed intense gentamicin immunolabeling within the cytoplasm and axons but not within the nucleus. (E) High-resolution image of the boxed area in (D) for gentamicin immunofluorescence only. Gentamicin immunolabeling is intense and granular in cytoplasm (thin arrow in E and F) and is absent in the neuronal nucleus (thick arrow in E and F). (F) Magnified image of the boxed area in D for all three fluorophores. Fewer and larger diameter gentamicin immunolabled neurons are present in the M-EVe than in the L-EVe. The fluorescence intensity of gentamicin immunolabeling was similar between M-EVe and L-EVe. Scale bar = 50 μm. (For interpretation of the references to color in this figure legend, the reader is referred to the web version of this article.)

