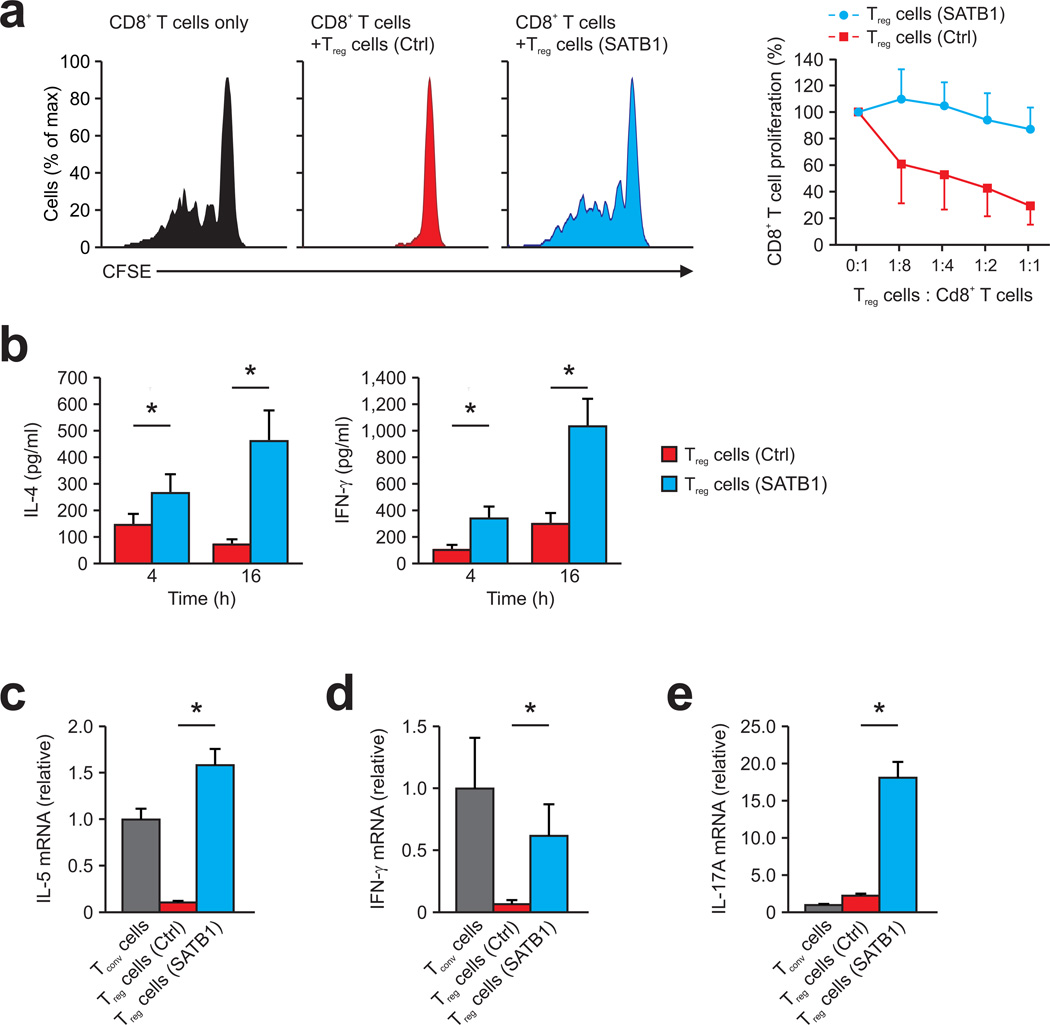
Figure 5. SATB1 expression in human Treg reprograms Treg into effector T cells.
(a) Suppression of CD8+ T cells, labeled with the cytosolic dye CFSE (CD8+ T cells) by human Treg lentivirally transduced with SATB1 (Treg cells (SATB1), blue) or control vector (Treg cells (Ctrl), red), presented as CFSE dilution in responding T cells cultured with CD3-coated beads and Treg at a ratio of 1:1 or without Treg (CD8+ T cells only; left), and as percent proliferating CD8+ T cells versus the Treg cell/CD8+ T cell ratio (right). Data are representative of three independent experiments (mean and s.d.) with cells derived from different donors. (b) Cytometric bead assay for IL-4 and IFN-γ secretion in the supernatants of human Treg lentivirally transduced with SATB1 (Treg cells (SATB1), blue) or control vector (Treg cells (Ctrl), red) assessed 4 and 16 h after stimulation with CD3+CD28-coated beads. *P < 0.05 (Student’s t-test). Data is from one representative experiment of two (mean and s.d. of triplicate wells) with cells derived from different donors. (c–e) Relative IL-5 (c), IFN-γ (d), and IL-17A (e) mRNA expression (right) in human Tconv (grey) and Treg lentivirally transduced with SATB1 (Treg cells (SATB1), blue) or control vector (Treg cells (Ctrl), red) activated for 16 h with CD3+CD28-coated beads. *P < 0.05 (Student’s t-test). Data is from one representative experiment of two (mean and s.d. of triplicate wells) with cells derived from different donors.

