
Table 1.
Differences between morphological changes on CT with true-positive lesions on each bone scan or FDG PET
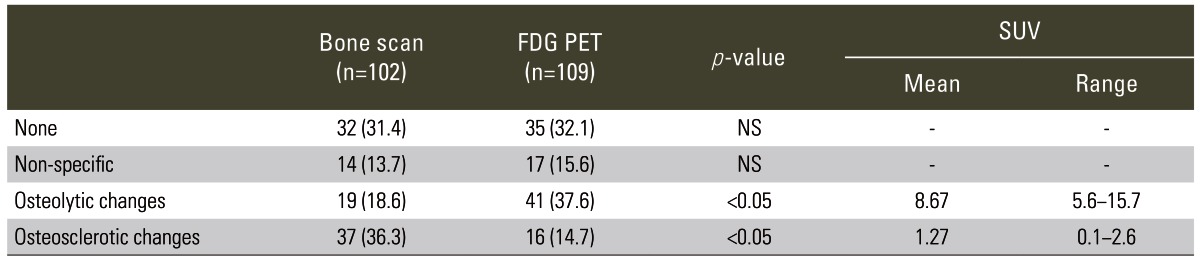
Values are presented as bone scan and FDG PET represent number of lesions.
Data in parentheses are percentages.
p<0.05; for "Bone scan" and "FDG PET" (by Mann-Whitney U-test).
CT, computed tomography; FDG, fluorodeoxyglucose; PET, positron emission tomography; SUV, standardized uptake value; NS, not significant.