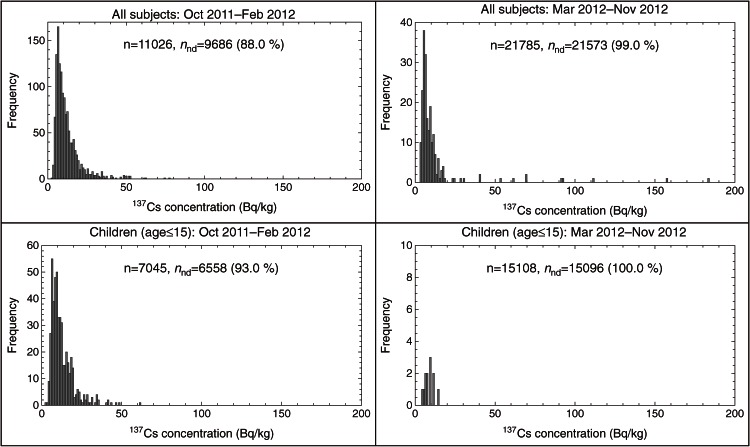
Figure 6.
137Cs concentration for all subjects (top) and for children only (bottom), in 1 Bq/kg increments. The right-hand panels are for the period when a change of clothes was instituted for all subjects to minimize spurious readings from surface contamination. Note the different ordinate scale for each panel. Nonexposed (non-detected) subjects are excluded from the plot.

