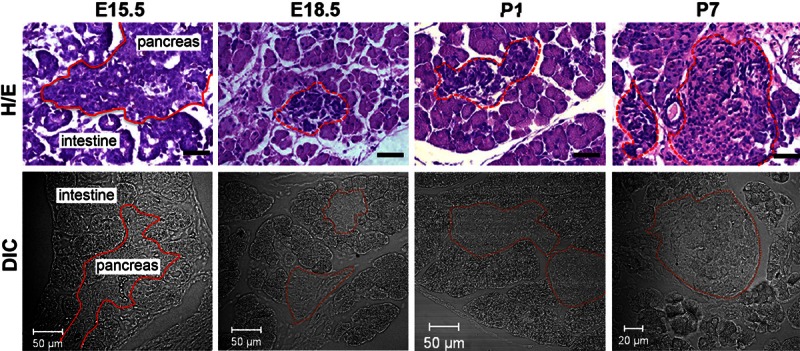
Figure 1.

General structure of the mouse pancreas at late embryonic and early postnatal stages. Upper row: Typical pictures of hematoxylin and eosin (H/E) stained mouse pancreata at E15.5, E18.5, P1 and P7. Black bar represents 50 μm. Lower row: Shown are representative images of mouse pancreata at E15.5, E18.5, P1 and P7, collected by means of differential interference contrast (DIC) microscopy. Note: in both upper and lower rows, the solid lines in pictures of E15.5 tissue sections outline the border of the pancreas, and the dotted lines in pictures of E18.5, P1 and P7 pancreatic slices delineate islets of Langerhans.
