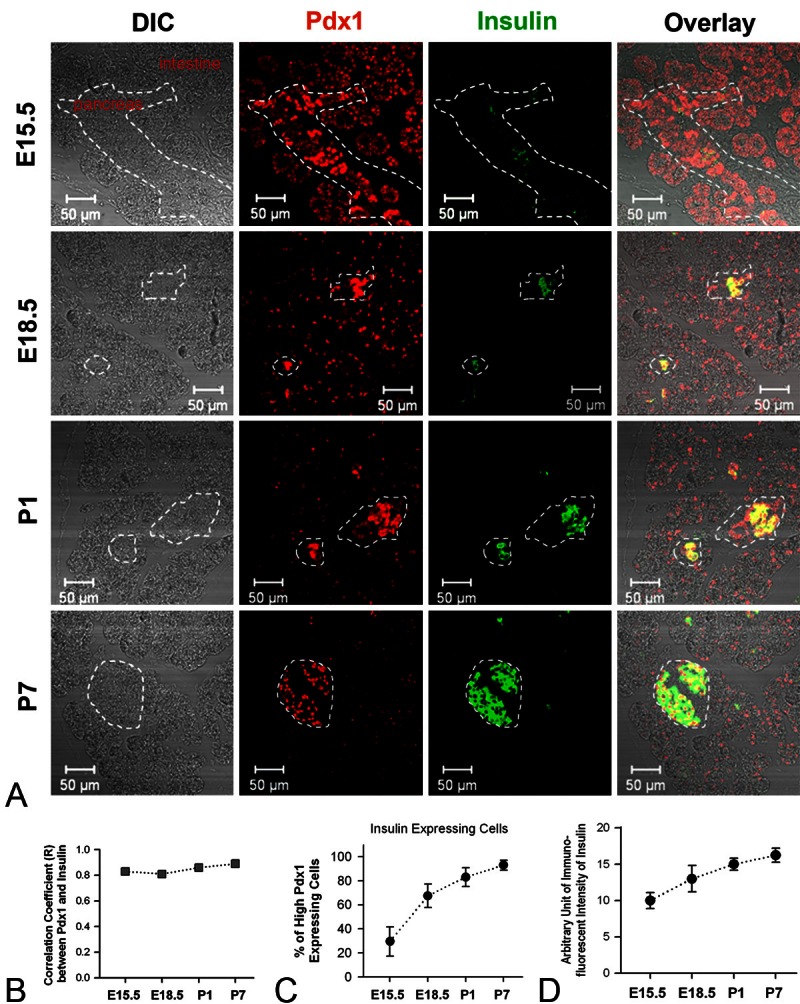
Figure 2.

Expression patterns of Pdx1 and insulin in the late embryonic and early postnatal pancreas of mice. A. Representative pictures of double-staining of Pdx1 and insulin of mouse pancreata at E15.5, E18.5, P1 and P7. Note: the dotted lines in pictures of E15.5 tissue slice outline the border of pancreas, whereas the lines in E18.5, P1 and P7 pancreatic sections delineate islets of Langerhans. B. Shown are the correlation coefficient (R) between the immunofluorescence of Pdx1 and immunofluorescence of insulin in pancreatic tissue slices of mice at different developmental stages (at E15.5, E18.5, P1 and P7, R = 0.83, 0.81, 0.86 and 0.89, respectively). C. Graph summarizes the percentage of high-Pdx1 expressing cells that express insulin at different developmental stages (at E15.5, E18.5, P1 and P7, the percentage = 29.5 ± 12.2, 67.5 ± 9.7, 83.0 ± 7.7 and 93.0 ± 4.2, respectively). D. Graph shows the arbitrary unit of immunofluorescent intensity of insulin in pancreatic slices at E15.5, E18.5, P1 and P7 (the intensity unit = 10.0 ± 1.1, 13.0 ± 1.8, 15.0 ± 0.82 and 16.3 ± 0.96, respectively).
