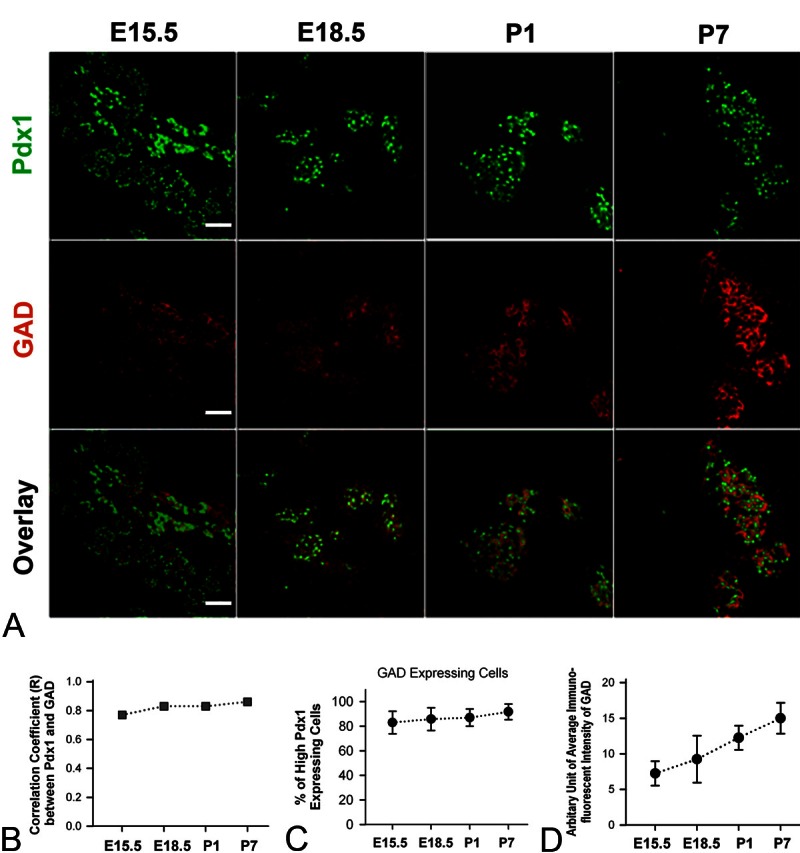
Figure 3.

Expression profiles of Pdx1 and GAD in developing mouse pancreas. A. Shown are illustrative pictures of double-staining of Pdx1 and GAD of mouse pancreata at E15.5, E18.5, P1 and P7. White bar = 50 μm. B. Correlation coefficient (R) between the Pdx1 immunoluorescence and GAD immunofluorescence in pancreatic tissue slices of mice at E15.5, E18.5, P1 and P7 (R = 0.77, 0.83, 0.83 and 0.86, respectively). C. The percentage of high-Pdx1 expressing cells that express GAD at E15.5, E18.5, P1 and P7 (The percentage = 83.0 ± 9.2, 85.8 ± 9.3, 87.0 ± 7.0 and 91.8 ± 6.3, respectively). D. Graph shows the arbitrary unit of immunofluorescent intensity of GAD in pancreatic slices at E15.5, E18.5, P1 and P7 (the intensity unit = 7.3 ± 1.7, 9.3 ± 3.3, 12.2 ± 1.7 and 15.0 ± 2.2, respectively).
