Figure 6.

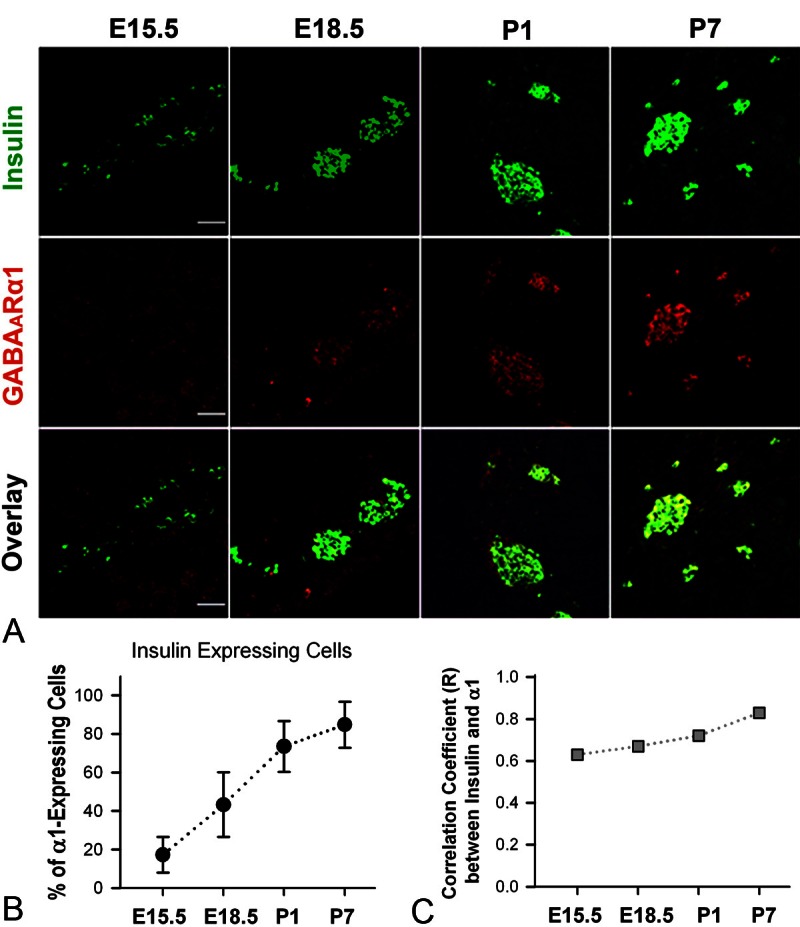
Expression of GABAARα1 and insulin in developing mouse pancreas. A. Illustrative images of double-staining of GABAARα1 and insulin of mouse pancreata at E15.5, E18.5, P1 and P7. White bar = 50 μm. B. The percentage of GABAARα1-expressing cells that express insulin at E15.5, E18.5, P1 and P7 (The percentage = 17.3 ± 9.3, 43.3 ± 16.8, 73.5 ± 13.2 and 84.8 ± 12.0, respectively). C. Correlation coefficient (R) between the GABAARα1 immunoluorescence and insulin immunofluorescence in mouse pancreata at E15.5, E18.5, P1 and P7 (R = 0.63, 0.67, 0.72 and 0.83, respectively).
