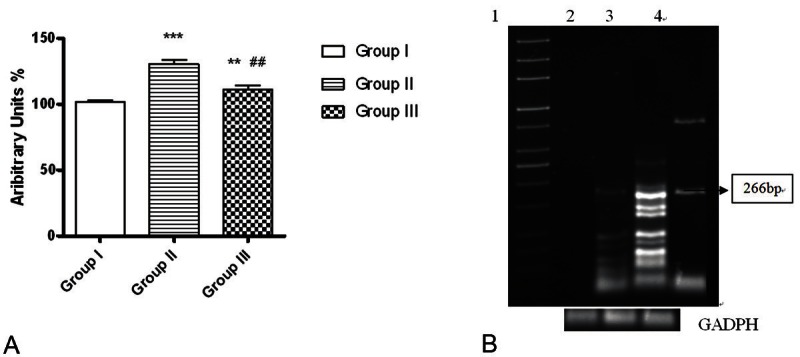
Figure 5.

Representative graph corresponding to PTHrP mRNA changes (evaluated by RT-PCR) in the kidney of all studied groups. A. Telmisartan treatment decreased PTHrP mRNA in renal tissues of group III. B. PhosphorImager analysis of RT-PCR amplification using specific oligonucleotide primers for PTHrP mRNA in the kidney of control, group II and group III. Total RNA isolated from all Kidneys was used for RT-PCR reactions as described in Materials and Methods. Lane 1 from the left is the 1-kb ladder control; lane 2: group I, lanes 3: group II, and 4: group III correspond to the primers specific for PTHr-P at 266 bp. GAPDH mRNA was included as a constitutive control. *p<0.05,***p<0.001 as compared to control group. ##p<0.01 as compared to group II.
