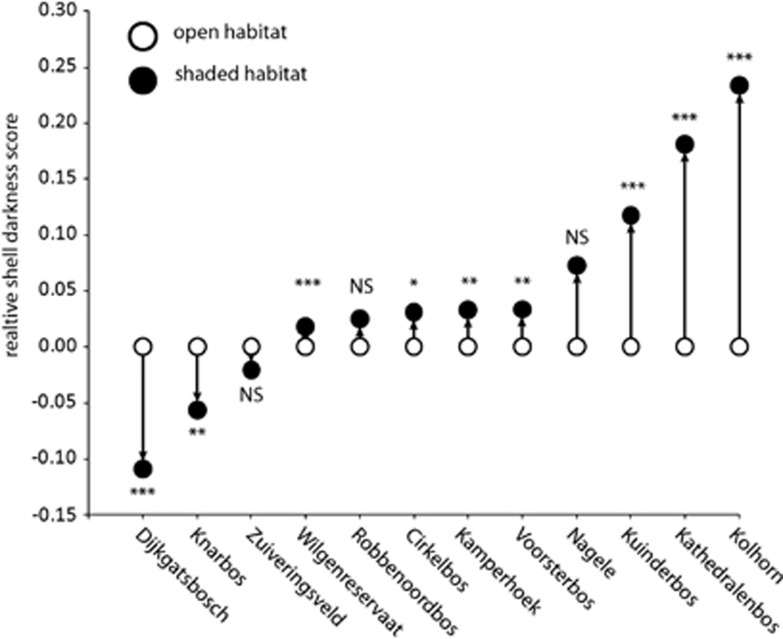
Figure 4.
Diagram showing mean darkness scores for the shaded habitats compared with the corresponding open habitats (for convenience, darkness score set to zero for the open habitat). Statistical significances (Kruskall–Wallis one-way analysis of variance): NS P>0.05; *P<0.05; **P<0.01; ***P<0.001. The overall pattern of a change towards darker shells in shaded habitats is significant (P<0.001; Fisher's combined probability test).

