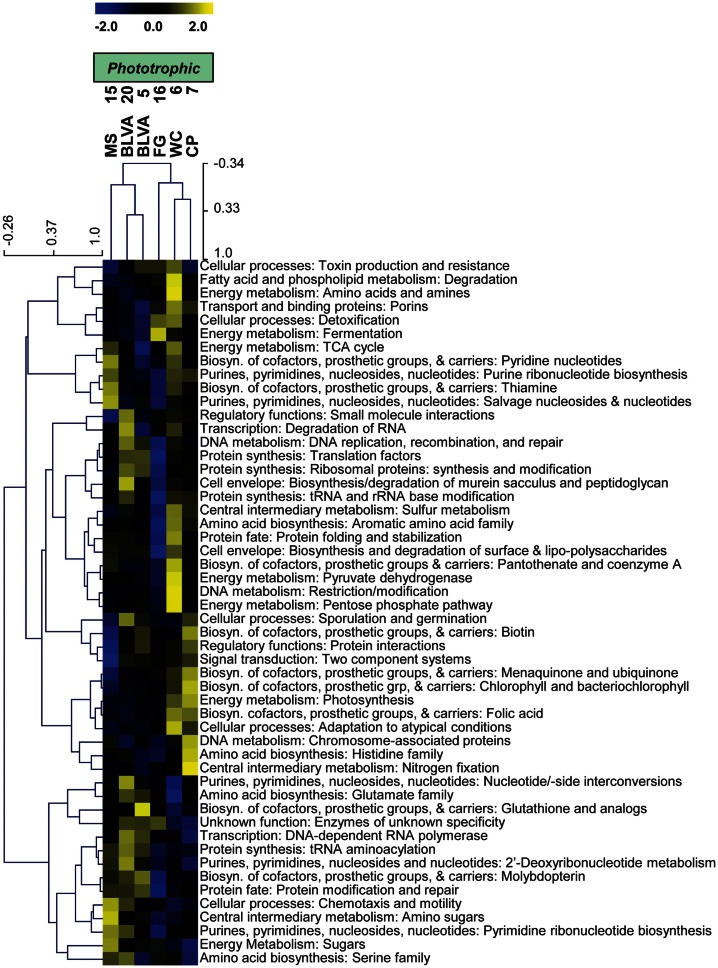
Figure A8.
Hierarchical cluster analysis of relative abundances of genes in all TIGRFAMs grouped into functional categories. Data were standardized by functional category before clustering to avoid biasing analysis by a few categories with high gene abundance. Pearson correlation was used as the distance measure for average linkage agglomerative clustering.

