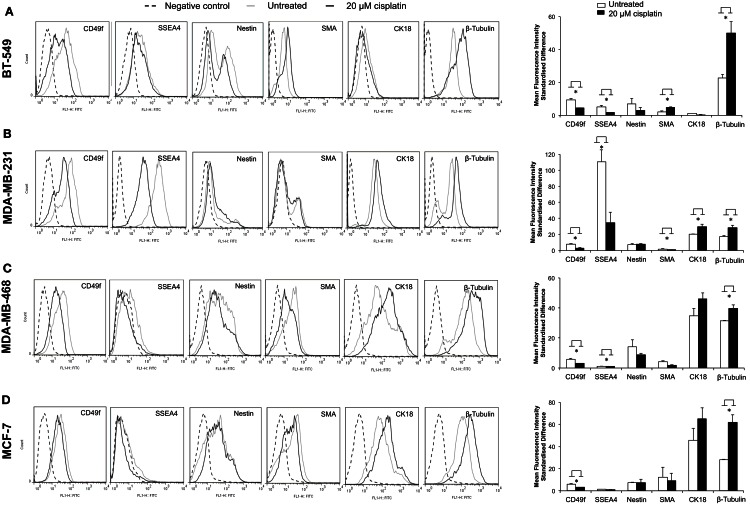
Figure 2.
Cisplatin shifts breast cancer cells toward a more differentiated phenotype. Flow cytometric quantification of CD49f, SSEA4, nestin, SMA, CK18, and β-tubulin protein expression showed various levels in four breast cancer cell lines. (A–D) show flow cytometry histograms of expression of the above markers in BT-549, MDA-MB-231, MDA-MB-468, and MCF-7 (black dashed line: unstained control; gray line: FITC-stained untreated breast cancer cells; black line: FITC-stained 20 μM cisplatin-treated breast cancer cells). The bar charts show quantification of the level of expression based on the mean fluorescence intensity (MFI) standardized difference of cisplatin-treated (20 μM cisplatin for 24 h) and untreated BT-549, MDA-MB-231, MDA-MD-468, and MCF-7 breast cancer cells. Bars are presented as mean fluorescence intensity (MFI) standardized difference ± SEM (n = 3). *p ≤ 0.05.

